

Pooled CRISPR screening in pancreatic cancer cells implicates co-repressor complexes as a cause of multiple drug resistance via regulation of epithelial-to-mesenchymal transition
- PMID: 34049503
- PMCID: PMC8164247
- DOI: 10.1186/s12885-021-08388-1
Pooled CRISPR screening in pancreatic cancer cells implicates co-repressor complexes as a cause of multiple drug resistance via regulation of epithelial-to-mesenchymal transition
Abstract
Background: Pancreatic ductal adenocarcinoma (PDAC) patients suffer poor outcomes, including a five-year survival of below 10%. Poor outcomes result in part from therapeutic resistance that limits the impact of cytotoxic first-line therapy. Novel therapeutic approaches are needed, but currently no targeted therapies exist to treat PDAC.
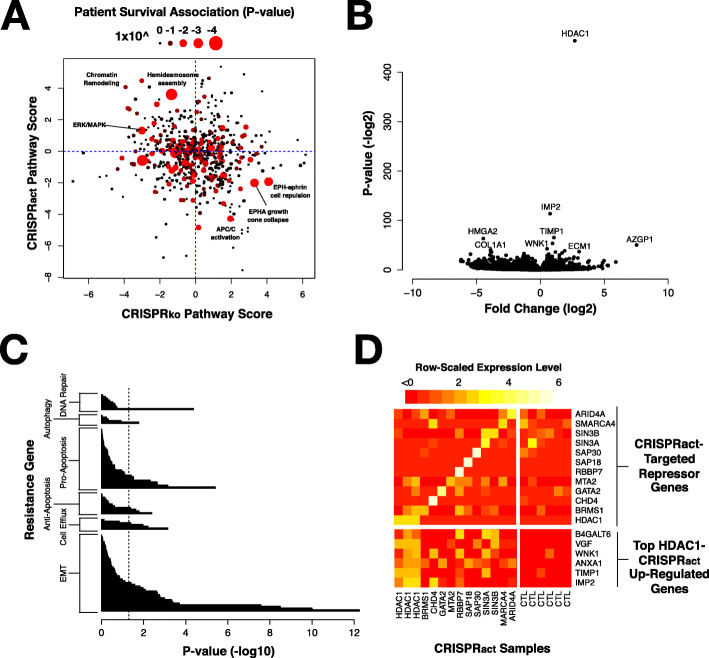
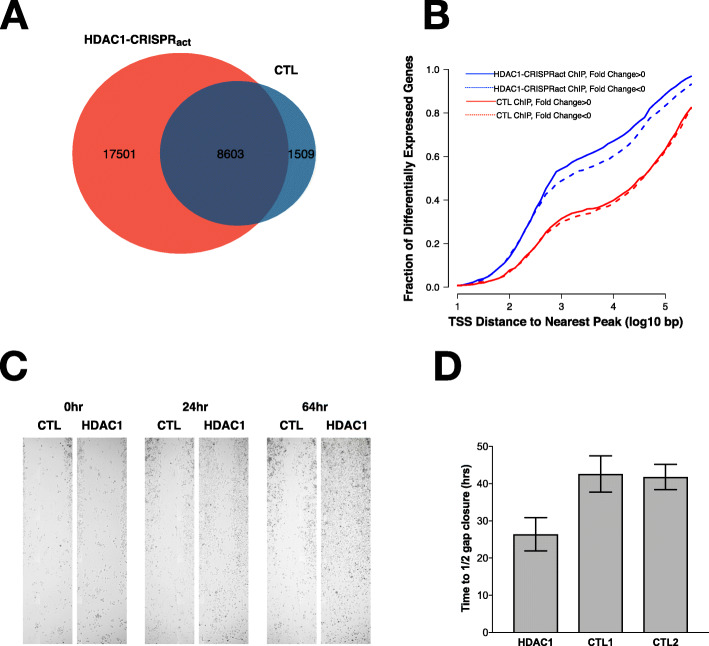
Methods: To assess cellular resistance mechanisms common to four cytotoxic chemotherapies (gemcitabine, 5-fluorouracil, irinotecan, and oxaliplatin) used to treat PDAC patients, we performed four genome-wide CRISPR activation (CRISPRact) and CRISPR knock-out (CRISPRko) screens in two common PDAC cell lines (Panc-1 and BxPC3). We used pathway analysis to identify gene sets enriched among our hits and conducted RNA-sequencing and chromatin immunoprecipitation-sequencing (ChIP-seq) to characterize top hits from our screen. We used scratch assays to assess changes in cellular migration with HDAC1 overexpression.
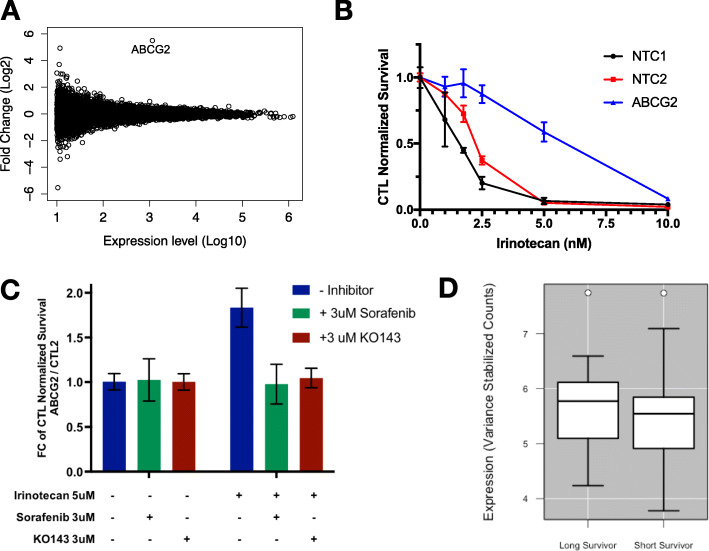
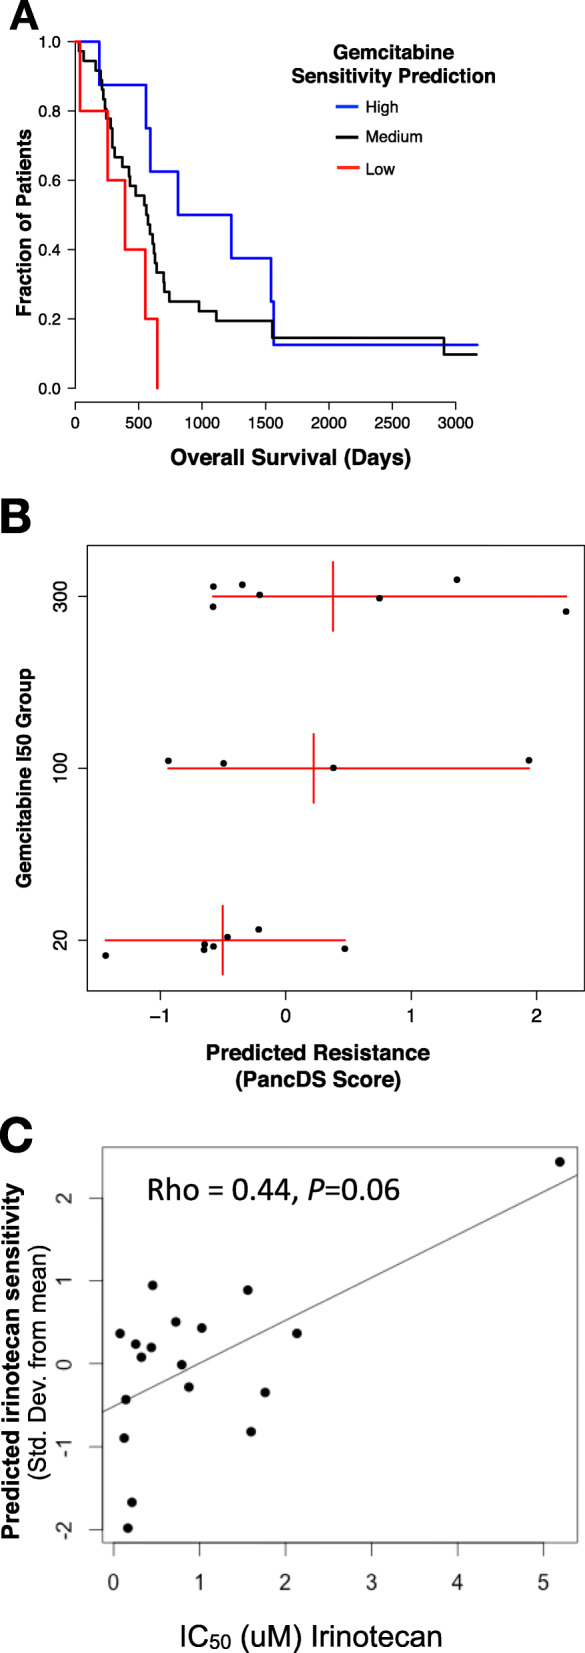
Results: Our data revealed activation of ABCG2, a well-described efflux pump, as the most consistent mediator of resistance in each of our screens. CRISPR-mediated activation of genes involved in transcriptional co-repressor complexes also conferred resistance to multiple drugs. Expression of many of these genes, including HDAC1, is associated with reduced survival in PDAC patients. Up-regulation of HDAC1 in vitro increased promoter occupancy and expression of several genes involved in the epithelial-to-mesenchymal transition (EMT). These cells also displayed phenotypic changes in cellular migration consistent with activation of the EMT pathway. The expression changes resulting from HDAC1 activation were also observed with activation of several other co-repressor complex members. Finally, we developed a publicly available analysis tool, PancDS, which integrates gene expression profiles with our screen results to predict drug sensitivity in resected PDAC tumors and cell lines.
Conclusion: Our results provide a comprehensive resource for identifying cellular mechanisms of drug resistance in PDAC, mechanistically implicate HDAC1, and co-repressor complex members broadly, in multi-drug resistance, and provide an analytical tool for predicting treatment response in PDAC tumors and cell lines.
Keywords: ABCG2; CRISPR; Drug resistance; Genome-wide screen; HDAC1; Pancreatic cancer; Precision oncology.
Conflict of interest statement
None reported.
Figures

Similar articles
-
SCNrank: spectral clustering for network-based ranking to reveal potential drug targets and its application in pancreatic ductal adenocarcinoma.BMC Med Genomics. 2020 Apr 3;13(Suppl 5):50. doi: 10.1186/s12920-020-0681-6. BMC Med Genomics. 2020. PMID: 32241274 Free PMC article.
-
Transcriptomic and functional analysis of ANGPTL4 overexpression in pancreatic cancer nominates targets that reverse chemoresistance.BMC Cancer. 2023 Jun 8;23(1):524. doi: 10.1186/s12885-023-11010-1. BMC Cancer. 2023. PMID: 37291514 Free PMC article.
-
TET1 downregulates epithelial-mesenchymal transition and chemoresistance in PDAC by demethylating CHL1 to inhibit the Hedgehog signaling pathway.Oncogene. 2020 Sep;39(36):5825-5838. doi: 10.1038/s41388-020-01407-8. Epub 2020 Aug 4. Oncogene. 2020. PMID: 32753651
-
Involvement of epithelial to mesenchymal transition in the development of pancreatic ductal adenocarcinoma.J Gastroenterol. 2015 Feb;50(2):140-6. doi: 10.1007/s00535-014-0997-0. Epub 2014 Sep 14. J Gastroenterol. 2015. PMID: 25216997 Review.
-
Epigenetic Landscape in Pancreatic Ductal Adenocarcinoma: On the Way to Overcoming Drug Resistance?Int J Mol Sci. 2020 Jun 8;21(11):4091. doi: 10.3390/ijms21114091. Int J Mol Sci. 2020. PMID: 32521716 Free PMC article. Review.
Cited by
-
Epigenetic control of pancreatic cancer metastasis.Cancer Metastasis Rev. 2023 Dec;42(4):1113-1131. doi: 10.1007/s10555-023-10132-z. Epub 2023 Sep 2. Cancer Metastasis Rev. 2023. PMID: 37659057 Free PMC article. Review.
-
Cancer Stem Cells: Current Challenges and Future Perspectives.Methods Mol Biol. 2024;2777:1-18. doi: 10.1007/978-1-0716-3730-2_1. Methods Mol Biol. 2024. PMID: 38478332 Review.
-
CRISPR/Cas technologies in pancreatic cancer research and therapeutics: recent advances and future outlook.Discov Oncol. 2025 Aug 11;16(1):1530. doi: 10.1007/s12672-025-03383-5. Discov Oncol. 2025. PMID: 40789802 Free PMC article. Review.
-
KRAS inhibition reverses chemotherapy resistance promoted by therapy-induced senescence-like in pancreatic ductal adenocarcinoma.Transl Oncol. 2025 Jul;57:102421. doi: 10.1016/j.tranon.2025.102421. Epub 2025 May 17. Transl Oncol. 2025. PMID: 40382842 Free PMC article.
-
Functional genomics reveals an off-target dependency of drug synergy in gastric cancer therapy.bioRxiv [Preprint]. 2023 Nov 19:2023.10.07.561351. doi: 10.1101/2023.10.07.561351. bioRxiv. 2023. Update in: Gastric Cancer. 2024 Nov;27(6):1201-1219. doi: 10.1007/s10120-024-01537-y. PMID: 37873383 Free PMC article. Updated. Preprint.
References
-
- Conroy T, Desseigne F, Ychou M, Bouché O, Guimbaud R, Bécouarn Y, Adenis A, Raoul JL, Gourgou-Bourgade S, de la Fouchardière C, Bennouna J, Bachet JB, Khemissa-Akouz F, Péré-Vergé D, Delbaldo C, Assenat E, Chauffert B, Michel P, Montoto-Grillot C, Ducreux M. FOLFIRINOX versus gemcitabine for metastatic pancreatic cancer. N Engl J Med. 2011;364(19):1817–1825. doi: 10.1056/NEJMoa1011923. - DOI - PubMed
MeSH terms
Substances
LinkOut - more resources
Full Text Sources
Other Literature Sources
Medical
Molecular Biology Databases
Research Materials
Miscellaneous
