

Cortical response to naturalistic stimuli is largely predictable with deep neural networks
- PMID: 34049888
- PMCID: PMC8163078
- DOI: 10.1126/sciadv.abe7547
Cortical response to naturalistic stimuli is largely predictable with deep neural networks
Abstract
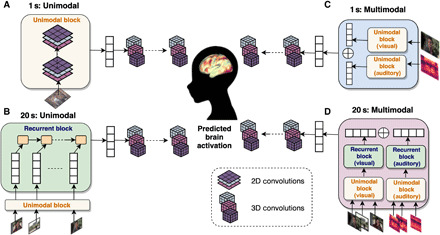
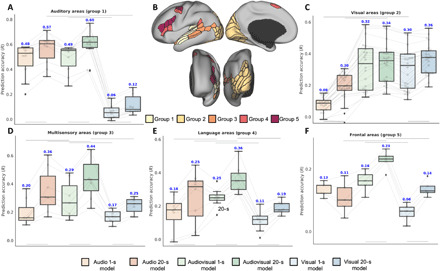
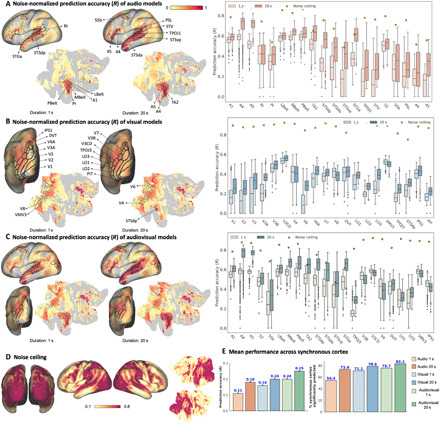
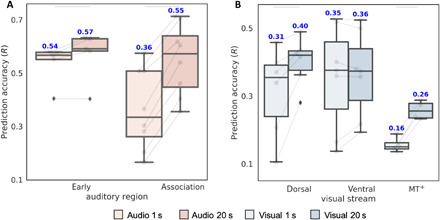
Naturalistic stimuli, such as movies, activate a substantial portion of the human brain, invoking a response shared across individuals. Encoding models that predict neural responses to arbitrary stimuli can be very useful for studying brain function. However, existing models focus on limited aspects of naturalistic stimuli, ignoring the dynamic interactions of modalities in this inherently context-rich paradigm. Using movie-watching data from the Human Connectome Project, we build group-level models of neural activity that incorporate several inductive biases about neural information processing, including hierarchical processing, temporal assimilation, and auditory-visual interactions. We demonstrate how incorporating these biases leads to remarkable prediction performance across large areas of the cortex, beyond the sensory-specific cortices into multisensory sites and frontal cortex. Furthermore, we illustrate that encoding models learn high-level concepts that generalize to task-bound paradigms. Together, our findings underscore the potential of encoding models as powerful tools for studying brain function in ecologically valid conditions.
Copyright © 2021 The Authors, some rights reserved; exclusive licensee American Association for the Advancement of Science. No claim to original U.S. Government Works. Distributed under a Creative Commons Attribution NonCommercial License 4.0 (CC BY-NC).
Figures
Similar articles
-
Mapping the time-varying functional brain networks in response to naturalistic movie stimuli.Front Neurosci. 2023 Jun 16;17:1199150. doi: 10.3389/fnins.2023.1199150. eCollection 2023. Front Neurosci. 2023. PMID: 37397459 Free PMC article.
-
Naturalistic Audio-Movies and Narrative Synchronize "Visual" Cortices across Congenitally Blind But Not Sighted Individuals.J Neurosci. 2019 Nov 6;39(45):8940-8948. doi: 10.1523/JNEUROSCI.0298-19.2019. Epub 2019 Sep 23. J Neurosci. 2019. PMID: 31548238 Free PMC article.
-
Neuromagnetic activation and oscillatory dynamics of stimulus-locked processing during naturalistic viewing.Neuroimage. 2020 Aug 1;216:116414. doi: 10.1016/j.neuroimage.2019.116414. Epub 2019 Nov 30. Neuroimage. 2020. PMID: 31794854
-
Encoding of naturalistic stimuli by local field potential spectra in networks of excitatory and inhibitory neurons.PLoS Comput Biol. 2008 Dec;4(12):e1000239. doi: 10.1371/journal.pcbi.1000239. Epub 2008 Dec 12. PLoS Comput Biol. 2008. PMID: 19079571 Free PMC article.
-
Linear Modeling of Neurophysiological Responses to Speech and Other Continuous Stimuli: Methodological Considerations for Applied Research.Front Neurosci. 2021 Nov 22;15:705621. doi: 10.3389/fnins.2021.705621. eCollection 2021. Front Neurosci. 2021. PMID: 34880719 Free PMC article. Review.
Cited by
-
Dissonant music engages early visual processing.Proc Natl Acad Sci U S A. 2024 Jul 23;121(30):e2320378121. doi: 10.1073/pnas.2320378121. Epub 2024 Jul 15. Proc Natl Acad Sci U S A. 2024. PMID: 39008675 Free PMC article.
-
A large and rich EEG dataset for modeling human visual object recognition.Neuroimage. 2022 Dec 1;264:119754. doi: 10.1016/j.neuroimage.2022.119754. Epub 2022 Nov 15. Neuroimage. 2022. PMID: 36400378 Free PMC article.
-
A hierarchy of processing complexity and timescales for natural sounds in human auditory cortex.bioRxiv [Preprint]. 2024 May 26:2024.05.24.595822. doi: 10.1101/2024.05.24.595822. bioRxiv. 2024. Update in: Proc Natl Acad Sci U S A. 2025 May 6;122(18):e2412243122. doi: 10.1073/pnas.2412243122. PMID: 38826304 Free PMC article. Updated. Preprint.
-
Encoding models for developmental cognitive computational neuroscience: Promise, challenges, and potential.Dev Cogn Neurosci. 2024 Dec;70:101470. doi: 10.1016/j.dcn.2024.101470. Epub 2024 Oct 30. Dev Cogn Neurosci. 2024. PMID: 39504850 Free PMC article. Review.
-
A rubric for human-like agents and NeuroAI.Philos Trans R Soc Lond B Biol Sci. 2023 Jan 30;378(1869):20210446. doi: 10.1098/rstb.2021.0446. Epub 2022 Dec 13. Philos Trans R Soc Lond B Biol Sci. 2023. PMID: 36511409 Free PMC article. Review.
References
-
- Varoquaux G., Poldrack R. A., Predictive models avoid excessive reductionism in cognitive neuroimaging. Curr. Opin. Neurobiol. 55, 1–6 (2019). - PubMed
Publication types
Grants and funding
LinkOut - more resources
Full Text Sources
Other Literature Sources
