. 2021 May 28;8(4):e1007.
doi: 10.1212/NXI.0000000000001007. Print 2021 Jul.

Gene-Environment Interactions in Multiple Sclerosis: A UK Biobank Study

Affiliations

Gene-Environment Interactions in Multiple Sclerosis: A UK Biobank Study

Benjamin Meir Jacobs et al. Neurol Neuroimmunol Neuroinflamm. .

Abstract

Objective: We sought to determine whether genetic risk modifies the effect of environmental risk factors for multiple sclerosis (MS). To test this hypothesis, we tested for statistical interaction between polygenic risk scores (PRS) capturing genetic susceptibility to MS and environmental risk factors for MS in UK Biobank.

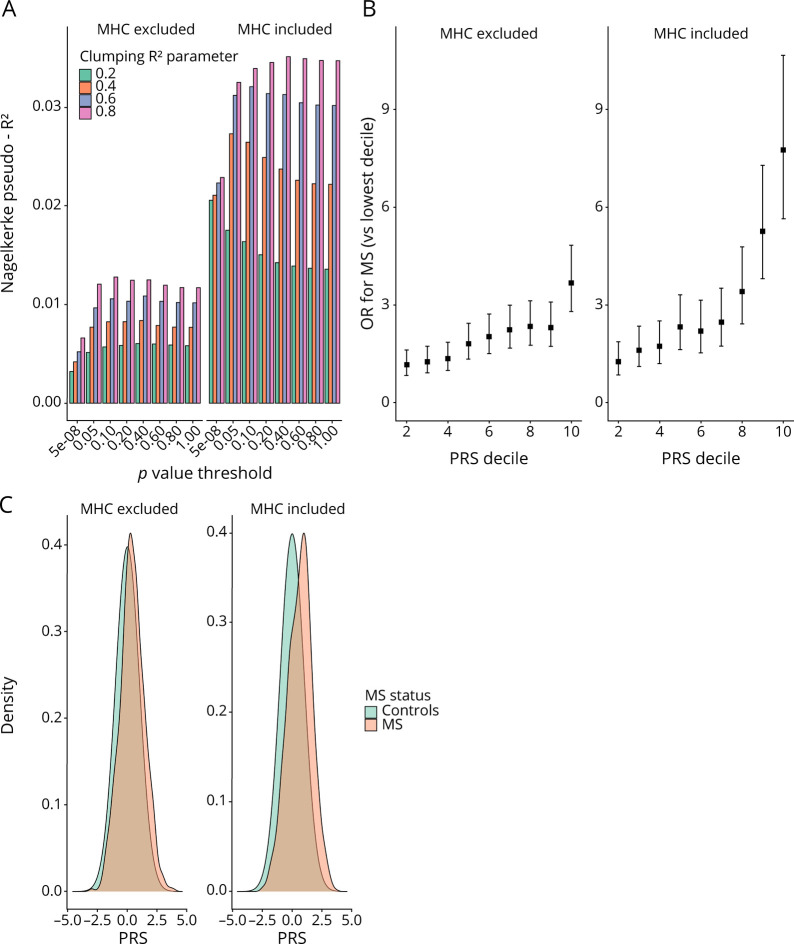
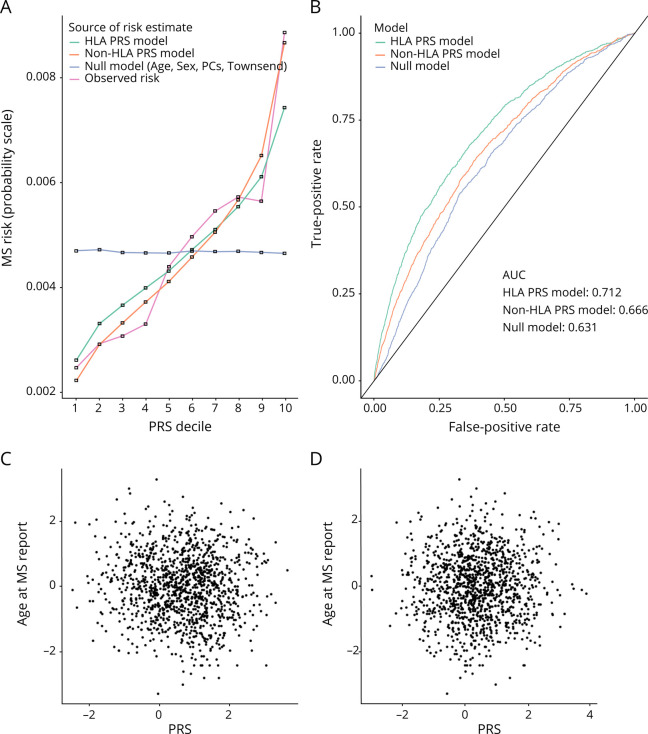
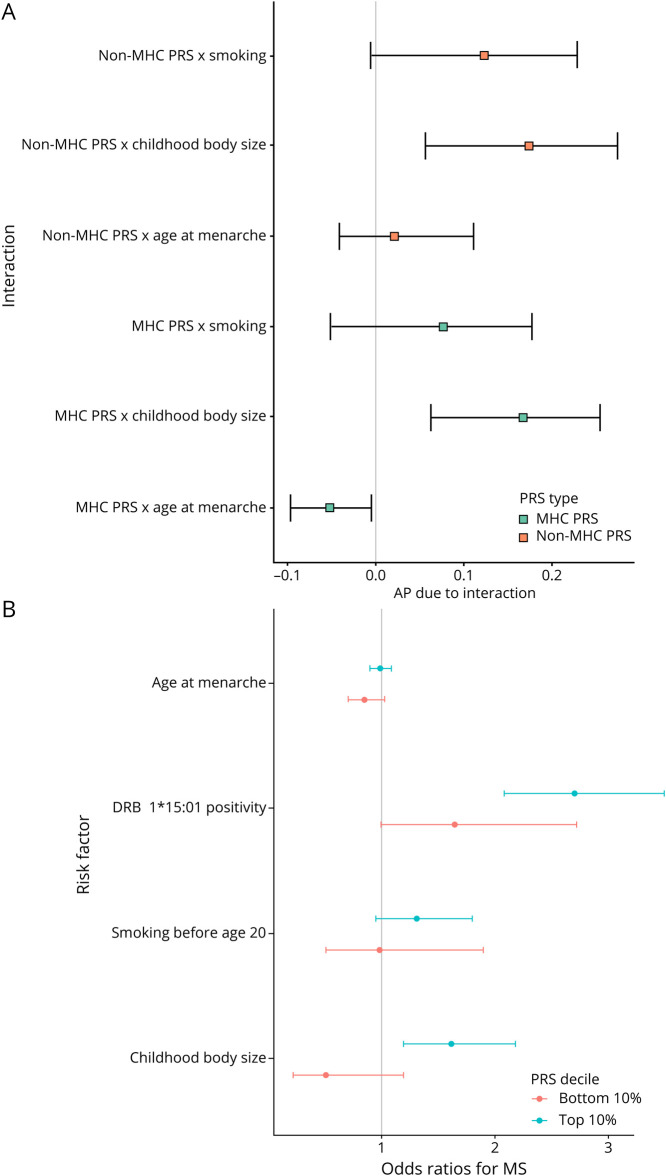
Methods: People with MS were identified within UK Biobank using ICD-10-coded MS or self-report. Associations between environmental risk factors and MS risk were quantified with a case-control design using multivariable logistic regression. PRS were derived using the clumping-and-thresholding approach with external weights from the largest genome-wide association study of MS. Separate scores were created including major histocompatibility complex (MHC) (PRSMHC) and excluding (PRSnon-MHC) the MHC locus. The best-performing PRS were identified in 30% of the cohort and validated in the remaining 70%. Interaction between environmental and genetic risk factors was quantified using the attributable proportion due to interaction (AP) and multiplicative interaction.

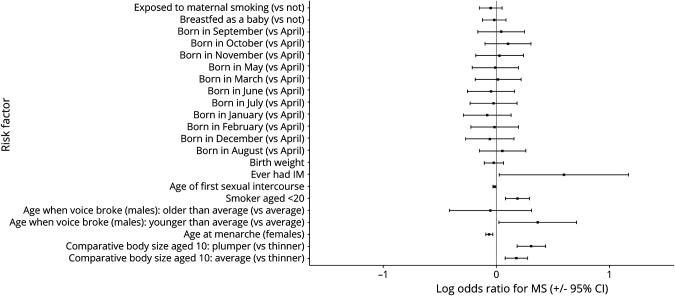
Results: Data were available for 2,250 people with MS and 486,000 controls. Childhood obesity, earlier age at menarche, and smoking were associated with MS. The optimal PRS were strongly associated with MS in the validation cohort (PRSMHC: Nagelkerke's pseudo-R2 0.033, p = 3.92 × 10-111; PRSnon-MHC: Nagelkerke's pseudo-R2 0.013, p = 3.73 × 10-43). There was strong evidence of interaction between polygenic risk for MS and childhood obesity (PRSMHC: AP = 0.17, 95% CI 0.06-0.25, p = 0.004; PRSnon-MHC: AP = 0.17, 95% CI 0.06-0.27, p = 0.006).

Conclusions: This study provides novel evidence for an interaction between childhood obesity and a high burden of autosomal genetic risk. These findings may have significant implications for our understanding of MS biology and inform targeted prevention strategies.


Figures

Figure 1
Figure 1. ORs and 95% CIs for the Association of Each Exposure With MS
ORs and CIs are from the output of a multivariable logistic regression with the following covariates: age, sex, ethnicity, birth latitude, current deprivation status, and the exposure in question. For menarche (females only) and voice breaking (males only), sex was not included as a covariate.
Figure 2
Figure 2. (A) Nagelkerke's Pseudo-R2 Metric for Each of the Individual PRS Used
The R2 was calculated by comparing the model fit (age, sex, Townsend deprivation index, the first 4 genetic PCs, and PRS) vs the null model (age, sex, Townsend deprivation index, and the first 4 genetic PCs). A variety of p value thresholds and clumping parameters were used to create different PRS. Note that the clumping R2 refers to the linkage disequilibrium threshold within which variants were “clumped” and is a different quantity from the Nagelkerke pseudo-R2. PRS are shown both including and excluding the major histocompatibility complex region. (B) ORs and 95% CIs for MS for individuals in each PRS decile (reference: lowest decile). ORs were calculated from logistic regression models with the following covariates: age, sex, first 4 genetic PCs, and PRS. (C) Histogram showing PRS distributions among MS cases and controls. MHC = major histocompatibility complex; PC = principal component; PRS = polygenic risk score.
Figure 3
Figure 3. (A) Calibration Plot Showing Absolute MS Disease Probabilities Within Each PRS Decile (of the Non-MHC PRS)
Other lines represent the mean fitted disease probabilities for models incorporating the MHC PRS, the non-MHC PRS, and null covariates alone (age, sex, deprivation, and genetic PCs). (B) Receiver operating characteristic (ROC) curves demonstrating the discriminative performance (i.e., ability to distinguish MS cases from controls) of each PRS. The null model, MHC PRS, and non-MHC PRS are shown. (C) Scatter plots showing no relationship between MHC PRS and normalized age at MS report. (D) Scatter plots showing no relationship between non-MHC PRS and normalized age at MS report. HLA = human leukocyte antigen; MHC = major histocompatibility complex; PC = principal component; PRS = polygenic risk score.
Figure 4
Figure 4. (A) Forest Plot Demonstrating Attributable Proportion due to Interaction (AP) and 95% CIs for Interactions Between Environmental Exposures and Genetic Risk Factors for MS
If there is no interaction, the AP is 0. AP > 1 indicates positive interaction (combined effects exceed the sum of the individual effects) and vice versa. CIs are derived from taking the 2.5th and 97.5th percentiles of 10,000 bootstrap replicates. (B) Forest plot demonstrating ORs and 95% CIs for participants in the top and bottom polygenic risk score deciles. The outcome in each case is MS status, and the exposures of interest are childhood body size, age at menarche, smoking before age 20 years, and carriage of the HLA DRB1*15:01 allele. ORs are from the output of the logistic regression model of the form MS risk ∼ age + sex + first 4 genetic PCs. Models were built separately for individuals with the highest 10% of genetic risk scores and the lowest 10% of genetic risk scores (“top” and “bottom” decile, respectively). MHC = major histocompatibility complex; PC = principal component; PRS = polygenic risk score.

Similar articles

Cited by

References

    1. International Multiple Sclerosis Genetics Consortium. Multiple sclerosis genomic map implicates peripheral immune cells and microglia in susceptibility. Science. 2019;365(6460):eaav7188. - PMC - PubMed
    1. Olsson T, Barcellos LF, Alfredsson L. Interactions between genetic, lifestyle and environmental risk factors for multiple sclerosis. Nat Rev Neurol. 2017;13(1):25-36. - PubMed
    1. Alfredsson L, Olsson T. Lifestyle and environmental factors in multiple sclerosis. Cold Spring Harb Perspect Med. 2019;9(4):a028944. - PMC - PubMed
    1. Disanto G, Dobson R, Pakpoor J, et al. . The refinement of genetic predictors of multiple sclerosis. PLoS One. 2014;9(5):e96578. - PMC - PubMed
    1. The International Multiple Sclerosis Genetics Consortium (IMSGC). Evidence for polygenic susceptibility to multiple sclerosis—the shape of things to come. Am J Hum Genet. 2010;86(4):621-625. - PMC - PubMed

Publication types

MeSH terms