. 2021 Aug;19(8):1361-1374.
doi: 10.1158/1541-7786.MCR-20-0833. Epub 2021 May 28.

R-Loop-Mediated ssDNA Breaks Accumulate Following Short-Term Exposure to the HDAC Inhibitor Romidepsin

Affiliations

R-Loop-Mediated ssDNA Breaks Accumulate Following Short-Term Exposure to the HDAC Inhibitor Romidepsin

Maryam Safari et al. Mol Cancer Res. 2021 Aug.

Abstract

Histone deacetylase inhibitors (HDACi) induce hyperacetylation of histones by blocking HDAC catalytic sites. Despite regulatory approvals in hematological malignancies, limited solid tumor clinical activity has constrained their potential, arguing for better understanding of mechanisms of action (MOA). Multiple activities of HDACis have been demonstrated, dependent on cell context, beyond the canonical induction of gene expression. Here, using a clinically relevant exposure duration, we established DNA damage as the dominant signature using the NCI-60 cell line database and then focused on the mechanism by which hyperacetylation induces DNA damage. We identified accumulation of DNA-RNA hybrids (R-loops) following romidepsin-induced histone hyperacetylation, with single-stranded DNA (ssDNA) breaks detected by single-cell electrophoresis. Our data suggest that transcription-coupled base excision repair (BER) is involved in resolving ssDNA breaks that, when overwhelmed, evolve to lethal dsDNA breaks. We show that inhibition of BER proteins such as PARP will increase dsDNA breaks in this context. These studies establish accumulation of R-loops as a consequence of romidepsin-mediated histone hyperacetylation. We believe that the insights provided will inform design of more effective combination therapy with HDACis for treatment of solid tumors. IMPLICATIONS: Key HDAC inhibitor mechanisms of action remain unknown; we identify accumulation of DNA-RNA hybrids (R-loops) due to chromatin hyperacetylation that provokes single-stranded DNA damage as a first step toward cell death.


Conflict of interest statement

T. Litman reports personal fees from LEO Pharma A/S outside the submitted work. A. Basseville reports grants from the European Commission during the conduct of the study. O.A. O'Connor reports grants from Celgene outside the submitted work. S.E. Bates reports grants from Celgene during the conduct of the study; as well as a patent for Depsipeptide for therapy of kidney cancer issued and Deacetylase inhibitor therapy issued. No disclosures were reported by the other authors.

Figures
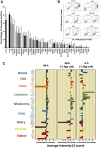
Figure 1.
Figure 1.
Different sensitivity spectrum of the NCI drug screen collection in 6- versus 48-hour assays. A, Analysis of apoptotic cell death in NCI-60 cell lines and HUT-78 following romidepsin treatment. Annexin V–positive cells were determined by flow cytometry. Results are baseline mean ± SD from three independent experiments. Each bar represents percentage of increase in cell death compared with untreated control. B, Representative histograms quantitating Annexin staining. C, A graphical representation of z-score of sensitivity of tumor cells to romidepsin following treatment. Drug sensitivity profiles in the NCI-60 cell lines plotted as mean graphs. In these profiles, the mean IC50 value for all cell lines is plotted as the center line. Then the difference in IC50 value for each cell line from the mean is plotted, as Z-scores, with the bars to the left indicating resistance and the bars to the right indicating sensitivity. Left, mean graph showing results following treatment with romidepsin in the conventional NCI-60 48-hour assay. Middle, eliminating cell lines previously shown to express Pgp (SF-295, HCT-15, SW-620, CCRF-CEM, EKVX, HOP-62, NCI-ADR-RES, A498, ACHN, CAKI-1, RXF-393, UO-31) in the 48-hour assay. Right, mean graph showing results of a 6-hour drug exposure after removing the Pgp-expressing cells.
Figure 2.
Figure 2.
Gene expression profiling shows impact on DNA repair genes. A, PCA plot showing that samples separate primarily into cell-specific clusters, rather than by treatment. The PCA plot is based on the 1851 probe sets that were found to be most variable across samples [applying a Variance filter of 0.4 sigma/sigma max (s/smax) >0.4 to maximize the projection score]. Samples are colored according to the cell line. B, Heat map and unsupervised 2-way hierarchical clustering of DEGs involved in DNA damage repair (DDR) pathways. Clustering is based on 47 DNA repair genes (out of 252) with P < 0.05, and expression fold change of >1.5-fold. Cell line removed as factor. Primary clustering according to romidepsin 6 hours Rx. C, Heat map and unsupervised 2-way hierarchical clustering of DEGs involved in DDR pathways from patients with Sezary syndrome treated with romidepsin for 24 hours. Clustering is based on 13 DNA repair genes (out of 252) with P < 0.05, and expression fold change of >2-fold.
Figure 3.
Figure 3.
γ-H2AX signal increases following romidepsin treatment. A, The expression of γ-H2AX following treatment with 100 nmol/L romidepsin in HUT-78, LOXIMVI, and A549 cell lines was detected by western blot assay. B, HUT-78 and LOXIMVI cells treated with 50 nmol/L romidepsin for 6 hours followed by incubation in the drug-free medium for additional time periods of (+6/+12/+18 hours). Presence of γ-H2AX and PARP signals were detected by western blot assay.
Figure 4.
Figure 4.
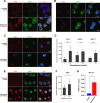
R-loop structures form following romidepsin treatment. A, DNA–RNA hybrid accumulation in romidepsin-treated cells. Staining was carried out using S9.6 and nucleolin antibodies. Nuclei were stained with DAPI. Bottom, treatment with RNase H in the romidepsin-treated cells eliminated the DNA–RNA hybrids. B, Quantification of nuclear S9.6 immunofluorescence signal in LOXIMVI cells treated with or without romidepsin and with RNase H following romidepsin treatment. The S9.6 signal was quantified only in the nuclear regions, DAPI staining. The median of the nuclear S9.6 signal intensity per nucleus is shown. ***, P < 0.001; ****, P < 0.000 (t test, two‐tailed). C, Detection of DNA–RNA hybrids in siFANCD2-transfected A549 cells. Top two demonstrating the untreated control and negative control of siRNA experiment and the bottom is showing positive R-loop staining in siFANCD2 cells. See also Supplementary Fig. S4A. D, DRIP–qPCR signal values at RPL13A, CALM3, TFPT, and SNRPN genes in LOXIMVI cells treated with or without romidepsin for 6 hours. LOXIMVI cells transfected with the FANCD2 siRNAs were included as positive control for R-loops. Cells treated in vitro with (bottom) or without (top) RNase H before immunoprecipitation. The mean ± SEM from three independent experiments is shown. E, ChIP-qPCR was performed with antibody against H3K9ac in the LOXIMVI cells after treatment with romidepsin for 6 hours. Immunoprecipitated chromatin samples were analyzed by qPCR using specific primer pairs as shown on Supplementary Table S1. The mean ± SEM from three independent experiments is shown.
Figure 5.
Figure 5.
Single-stranded DNA breaks following romidepsin treatment. DNA damage in HUT-78 and LOXIMVI cells treated with various concentrations of romidepsin for 6 hours was measured by single-cell gel electrophoresis (comet assay). DNA damage examined by fluorescence microscopy. A, Representative images of comet assay. B, Quantitative analysis of DNA damage. Average comet tail moment was calculated for at least 50 cells per sample. Tail moments = tail length × DNA in the tail/total DNA. Significance was calculated based on an unpaired student t test comparing each condition with the control. C, Quantitative analysis of DNA damage in LOXIMVI cells treated with 50 nmol/L romidepsin for 6 hours followed by additional incubation times in drug-free medium. Samples were run in tandem alkaline (A) and neutral (B) assay conditions to determine the type of DNA damage following treatment. *, P < 0.01; ***, P < 0.001; ****, P < 0.0001 (t test, two‐tailed).
Figure 6.
Figure 6.
R-loop structures co-localize with single-stranded DNA damage response proteins following romidepsin treatment. Co-localization of accumulated R-loops in the romidepsin treated cells with SSD repair proteins involved in BER. Nuclei were stained with DAPI. DNA–RNA hybrids accumulated in the nuclei and co-localized with POLβ (A), PARP1 (B), XRCC1 (C), and RPA1 (E) following romidepsin treatment in LOXIMVI cells. D, Quantification of nuclear POLβ, PARP1, and XRCC1 immunofluorescence signal in LOXIMVI cells treated with or without romidepsin for 6 hours. F, Quantification of nuclear RPA1. For each protein, signal was quantified only in the nuclear regions, defined by DAPI staining. The median of the signal intensity per nucleus is shown. ***, P < 0.001; ****, P < 0.000 (t test, two‐tailed). G, ChIP-qPCR was performed with antibody against RPA1 in the LOXIMVI cells after treatment with romidepsin for 6 hours. Immunoprecipitated chromatin samples were analyzed by qPCR using RPL13A primer sets. *, P < 0.03.
Figure 7.
Figure 7.
A, Co-localization of accumulated R-loops in the romidepsin treated cells with POL-II. Quantification of nuclear POL-II. Immunofluorescence signal in LOXIMVI cells treated with or without romidepsin for 6 hours. For each protein signal was quantified only in the nuclear regions, defined by DAPI staining. The median of the signal intensity per nucleus is shown; *, P < 0.01; ns, not significant (t test, two‐tailed). B, left, Analysis of γ-H2AX in the RNaseH1-transfected LOXIMVI cell line following romidepsin treatment. γ-H2AX signal was detected by western blot assay and quantified using Image Studio Software, the percentage of decrease in the expression of γ-H2AX signal relative to the wild-type parental cells is shown here. Treatment was for 6 hours followed by incubation in drug-free medium an additional 6 hours. B, right, Analysis of apoptotic cell death in both RNaseH1 transfected and wild-type (parental) LOXIMVI cell lines following romidepsin treatment. Annexin V–positive cells were determined by flow cytometry. Results are baseline mean ± SD from three independent experiments. Each bar represents percentage of increase in cell death compared with untreated control. *, P < 0.04 (t test, two‐tailed). C, LOXIMVI cells treated with romidepsin 50 nmol/L, PARP-inhibitor olaparib (10 μmol/L) and combination of romidepsin and olaparib for 6 hours and harvested immediately (6 hours) or incubated an additional 6 hours before harvest (12-hour time point). The presence of γ-H2AX signal was detected by western blot assay (left). Analysis of apoptotic cell death in the LOXIMVI cell line following treatment with romidepsin (50 and 200 nmol/L), olaparib alone (10 μmol/L), and 50 nmol/L romidepsin in combination with 10 μmol/L olaparib. Annexin V–positive cells were determined by flow cytometry (right).

Similar articles

Cited by

References

    1. Leder A, Leder P. Butyric acid, a potent inducer of erythroid differentiation in cultured erythroleukemic cells. Cell 1975;5:319–22. - PubMed
    1. Mickley LA, Bates SE, Richert ND, Currier S, Tanaka S, Foss F, et al. Modulation of the expression of a multidrug resistance gene (mdr-1/P-glycoprotein) by differentiating agents. J Biol Chem 1989;264:18031–40. - PubMed
    1. Bates SE, Mickley LA, Chen YN, Richert N, Rudick J, Biedler JL, et al. Expression of a drug resistance gene in human neuroblastoma cell lines: modulation by retinoic acid-induced differentiation. Mol Cell Biol 1989;9:4337–44. - PMC - PubMed
    1. Kitazono M, Robey R, Zhan Z, Sarlis NJ, Skarulis MC, Aikou T, et al. Low concentrations of the histone deacetylase inhibitor, depsipeptide (FR901228), increase expression of the Na+/I− symporter and iodine accumulation in poorly differentiated thyroid carcinoma cells. J Clin Endocrinol Metabol 2001;86:3430–5. - PubMed
    1. Ohlsson-Wilhelm BM, Farley BA, Kosciolek B, La Bella S, Rowley PT. K562 human erythroleukemia cell variants resistant to growth inhibition by butyrate have deficient histone acetylation. Am J Hum Genet 1984;36:1225–38. - PMC - PubMed

Publication types