. 2021 May 28;12(1):3235.
doi: 10.1038/s41467-021-23340-4.

Small sinking particles control anammox rates in the Peruvian oxygen minimum zone

Affiliations

Small sinking particles control anammox rates in the Peruvian oxygen minimum zone

Clarissa Karthäuser et al. Nat Commun. .

Abstract

Anaerobic oxidation of ammonium (anammox) in oxygen minimum zones (OMZs) is a major pathway of oceanic nitrogen loss. Ammonium released from sinking particles has been suggested to fuel this process. During cruises to the Peruvian OMZ in April-June 2017 we found that anammox rates are strongly correlated with the volume of small particles (128-512 µm), even though anammox bacteria were not directly associated with particles. This suggests that the relationship between anammox rates and particles is related to the ammonium released from particles by remineralization. To investigate this, ammonium release from particles was modelled and theoretical encounters of free-living anammox bacteria with ammonium in the particle boundary layer were calculated. These results indicated that small sinking particles could be responsible for ~75% of ammonium release in anoxic waters and that free-living anammox bacteria frequently encounter ammonium in the vicinity of smaller particles. This indicates a so far underestimated role of abundant, slow-sinking small particles in controlling oceanic nutrient budgets, and furthermore implies that observations of the volume of small particles could be used to estimate N-loss across large areas.


Conflict of interest statement

The authors declare no competing interests.

Figures

Fig. 1
Fig. 1. Physico-chemical parameters, particle abundance and anammox rates from an exemplary onshore and offshore station in the Peruvian upwelling system in April 2017.
In situ particle abundances and anammox rates from a onshore station 423 (total water depth 241 m) and c offshore station 549 (total water depth 4350 m). b and d Depth profiles of oxygen (purple line), ammonium (open circles) and nitrite (open triangles) concentrations. Particles were sorted into four size classes with equivalent spherical diameters (ESD) of 128–256, 256–512, 512–1024, and 1024–2048 µm. Particle abundances in the smallest size class reached up to 398 particles L−1 in the upper 20 m of the onshore station. Anammox rates were determined in time series incubations at six discrete depths. Significant rates are shown with closed circles, rates that are not significantly different from zero are shown with open circles (see Supplementary Table 1). Error bars represent the standard error of the slope. The base of the euphotic zone (where photosynthetically active radiation (PAR) dropped to <1%, based on Aqua-MODIS satellite data) and the oxic–anoxic interface (where O2 dropped to <1.5 µM) are indicated.
Fig. 2
Fig. 2. Particle volume and export production in the Peruvian upwelling system during April 2017.
Average particle volume profiles in (a) offshore and (b) onshore stations determined by the Underwater Vision Profiler camera system (UVP). Particles were sorted into four size classes with equivalent spherical diameters (ESD) of 128–256, 256–512, 512–1024, and 1024–2048 µm. The shaded envelopes correspond to standard deviation in abundances from 56 offshore and 37 onshore stations (cropped at 2 mm3 L−1 for visualization purposes). The base of the euphotic zone (where photosynthetically active radiation (PAR) dropped to <1%, based on Aqua-MODIS satellite data) and the oxic–anoxic interface (where O2 dropped to <1.5 µM) are indicated. c Export production estimated from satellite products (pseudocolor map, see the “Methods” section) and from particle abundances at the base of the euphotic zone (circles). The white line is the 600 m isobath on which basis the onshore and offshore stations were separated. Stations where anammox incubations were performed are circled in red, the elongated red circle encompasses four stations.
Fig. 3
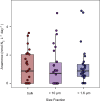
Fig. 3. Anammox rates determined from unfiltered water (bulk) and water filtered through either a 10 or 1.6 µm filter in the anoxic waters of the Peruvian upwelling system during April and June 2017.
Boxplots depict the 25–75% quantile range, with the centre line depicting the median (50% quantile); whiskers encompass data points within 1.5 times the interquartile range. A paired t-test (Supplementary Table 4) showed that there was no significant difference in rates between any of the treatments. Anammox rates from one depth are outside the range of the graph and had anammox rates of 14.1 nmol N2 L−1 day−1 (bulk water), 41.1 nmol N2 L−1 day−1 (10 µm filtered) and 8.7 nmol N2 L−1 day−1 (1.6 µm filtered). These values were included in the statistical analysis. At an additional 23 depths anammox rates were below detection limit in all size fractions and these were not included in the analysis. See Supplementary Fig. 7 for individual data points and Supplementary Table 1b for the standard error of the slope of each individual rate measurement.
Fig. 4
Fig. 4. Relationship between volumetric anammox rates and particle volumes from different size classes in the Peruvian upwelling system during April 2017.
Particles throughout the water column were quantified with an Underwater Vision Profiler camera system (UVP) and binned into four size classes with equivalent spherical diameters (ESD) of 128–256, 256–512, 512–1024, and 1024–2048 µm. Anammox rates were determined from the slope of 29N2 production over time in anoxic incubations after addition of 15NO2 (taking into consideration any contribution to 29N2 production from denitrification if a denitrification rate with p < 0.05 could be detected). For all particle size classes, there was a significant positive correlation (Spearman’s rank correlation; p = <0.05) between particle volume and anammox rates from the anoxic part of the oxygen minimum zone (O2 < 1.5 µM). The line is the linear regression from which the slope and R2 was calculated (see Supplementary Table 5 for all relevant statistics). Please note the different scales for the particle volume ad. One outlier was removed from the figures and correlation as it was more than 6 standard deviations from the mean in the smallest size fraction and it was the only sample from the euphotic zone (24.3 m depth). In ad, open and filled symbols depict offshore stations and onshore stations, respectively. In panel a, the correlation with the smallest size class (140–270 µm) during a cruise in February 2013 (M93) is included for comparison and depicted with grey x symbols. This dataset was not included in the linear regression but is included in Supplementary Table 1c. Correlations with the particle abundance in number per liter yielded similar results (see Supplementary Table 5).
Fig. 5
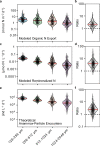
Fig. 5. Transport of nitrogen (N) from the euphotic zone through the water column.
a Modelled export of organic nitrogen from the euphotic zone into the oxygen minimum zone, c modelled nitrogen remineralization associated with particles in the anoxic water column (e) theoretical number of encounters between anammox bacteria and the particle boundary layer (see text for further information). b, d and f indicate the ratio of processes between the smaller (128–512 µm) and larger particles (512–2048 µm) from (a, c and e,) respectively. Ind: individuals. The outlines of the violin plots depict the kernel density estimation of the data points shown. The solid black line and solid red line indicate mean and median, respectively.
Fig. 6
Fig. 6. Regional estimate of nitrogen (N)-loss via anammox based on the volume of small particles (128–256 µm).
Anammox rates in the anoxic water column of Peruvian oxygen minimum zone (O2 < 1.5 µM) derived from UVP measurements carried out from March to July 2017 (black circles depict UVP casts during cruises M135–M138). Extrapolating these rates over a whole year would lead to a nitrogen loss of around 19 Tg. The red circles depict stations where the anammox rates were measured. The white line is the 600 m isobath.
Fig. 7
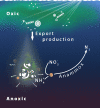
Fig. 7. Schematic illustration showing interactions between anammox bacteria and particles within the Peruvian oxygen minimum zone (OMZ).
Aggregated organic matter formed by primary production in euphotic surface waters sinks into the anoxic OMZ (export production). Subsequently, remineralization of the particles leads to the formation of ammonium, the limiting substrate for anammox. The ammonium diffuses into the particle boundary layer, leaving a plume in the wake of the sinking particles. Free-living anammox bacteria encounter the ammonium and utilize it as a substrate to carry out anammox, leading to the formation of dinitrogen gas (N2).

Similar articles

Cited by

References

    1. Lam P, Kuypers MMM. Microbial nitrogen cycling processes in oxygen minimum zones. Annu. Rev. Mar. Sci. 2011;3:317–345. doi: 10.1146/annurev-marine-120709-142814. - DOI - PubMed
    1. Codispoti LA, et al. The oceanic fixed nitrogen and nitrous oxide budgets: moving targets as we enter the anthropocene? Sci. Mar. 2001;65:85–105. doi: 10.3989/scimar.2001.65s285. - DOI
    1. Gruber N, Sarmiento JL. Global patterns of marine nitrogen fixation and denitrification. Glob. Biogeochem. Cycles. 1997;11:235–266. doi: 10.1029/97GB00077. - DOI
    1. Gruber, N. In The Ocean Carbon Cycle and Climate (eds Follows, M. & Oguz, T.) 97–148 (Springer Netherlands, 2004).
    1. Kalvelage T, et al. Nitrogen cycling driven by organic matter export in the South Pacific oxygen minimum zone. Nat. Geosci. 2013;6:228–234. doi: 10.1038/ngeo1739. - DOI

Publication types

LinkOut - more resources