. 2021 May 28;12(1):3209.
doi: 10.1038/s41467-021-23553-7.

Genome-resolved metagenomics reveals role of iron metabolism in drought-induced rhizosphere microbiome dynamics

Affiliations

Genome-resolved metagenomics reveals role of iron metabolism in drought-induced rhizosphere microbiome dynamics

Ling Xu et al. Nat Commun. .

Abstract

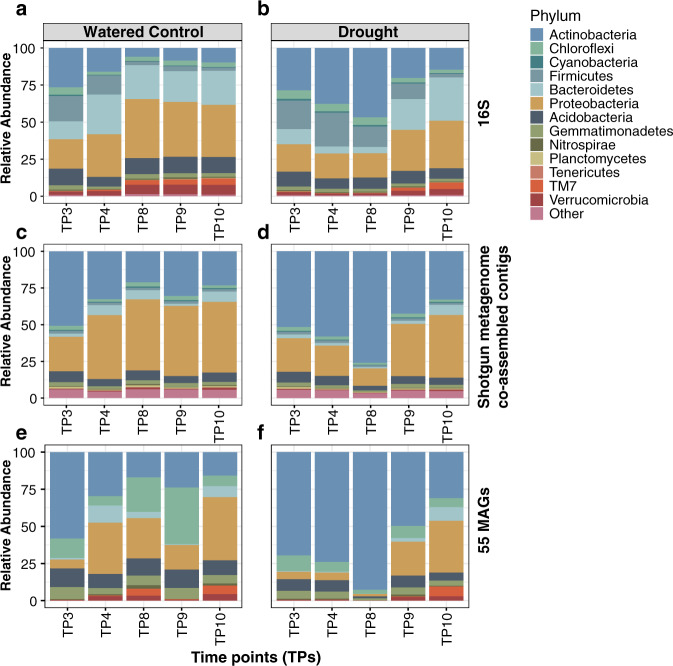
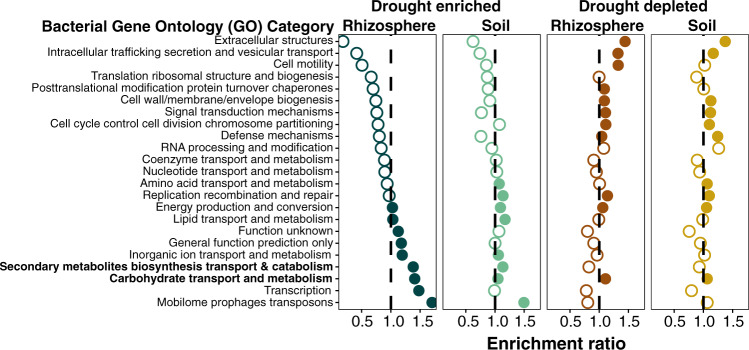
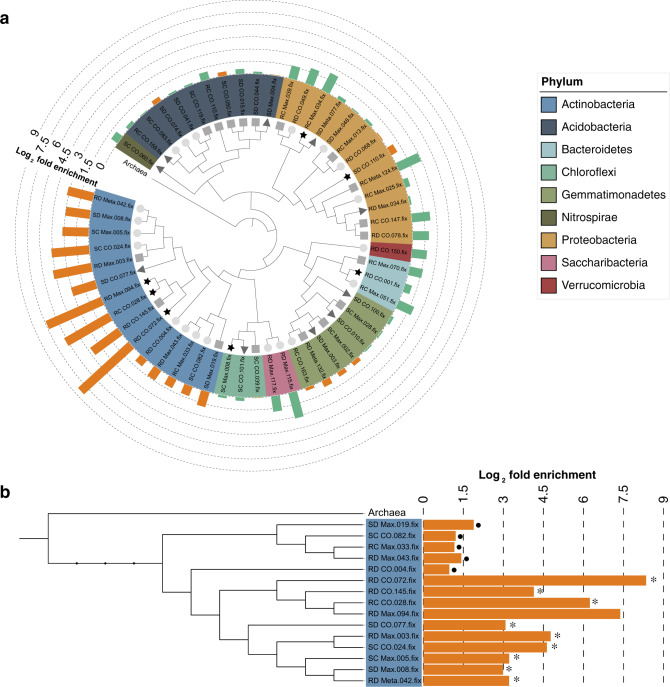
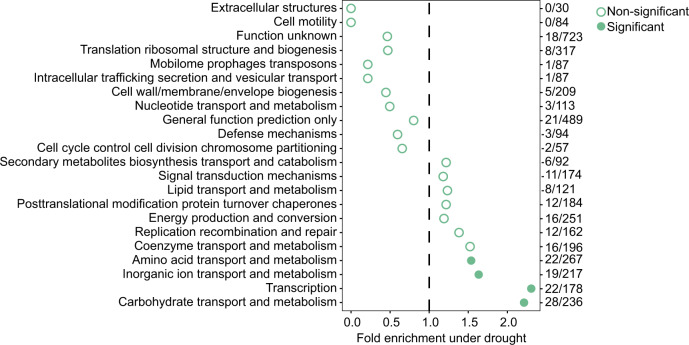
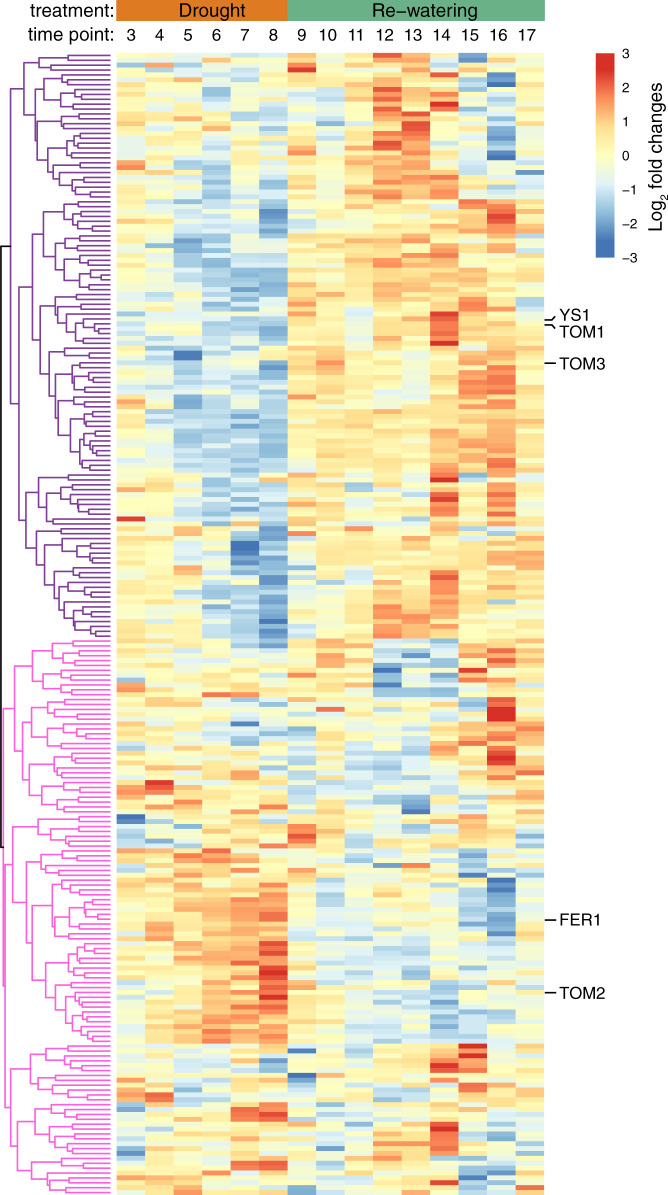
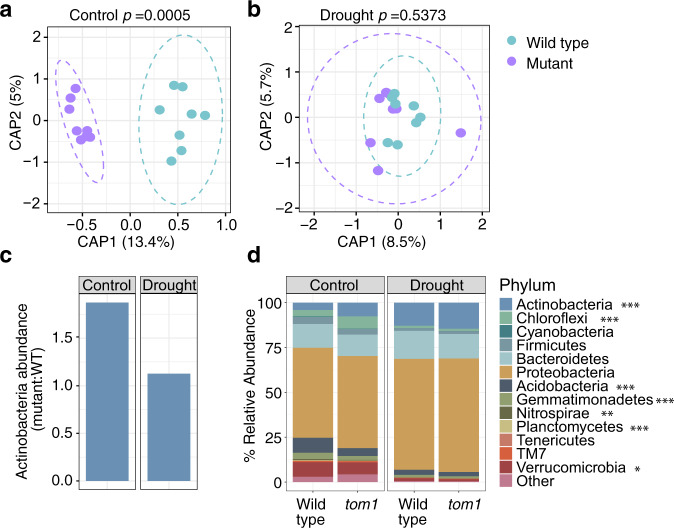
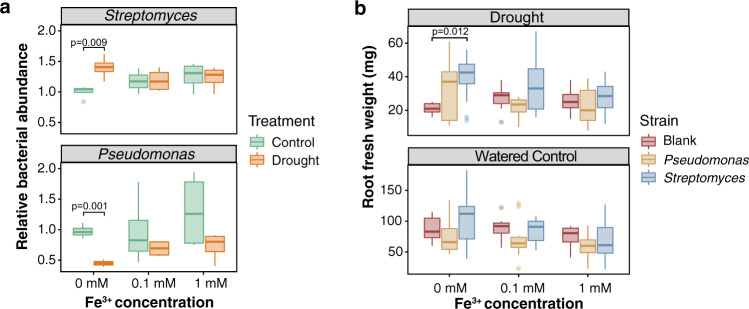
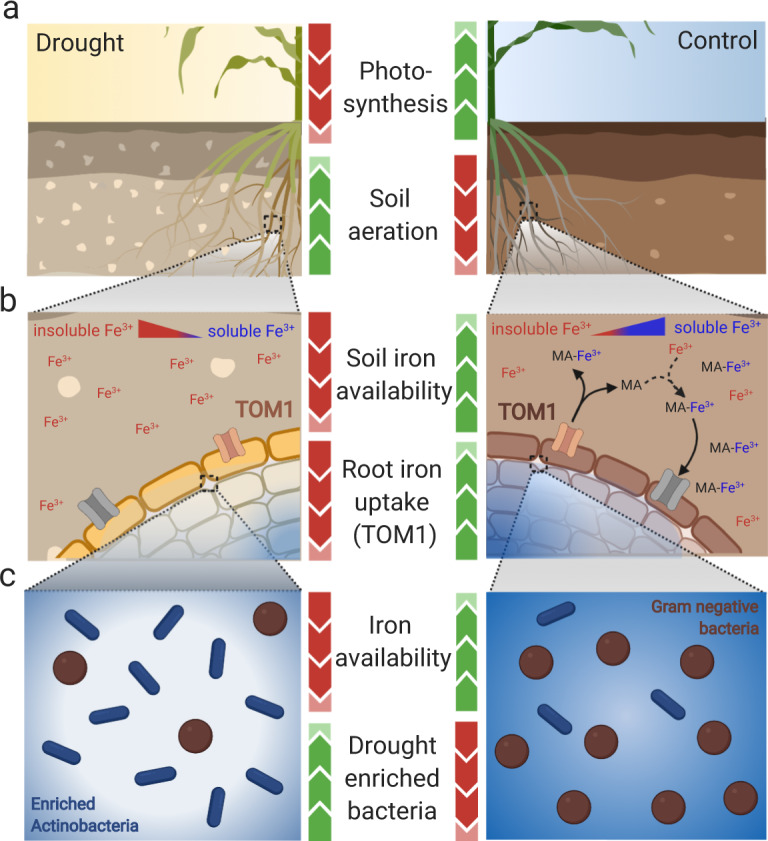
Recent studies have demonstrated that drought leads to dramatic, highly conserved shifts in the root microbiome. At present, the molecular mechanisms underlying these responses remain largely uncharacterized. Here we employ genome-resolved metagenomics and comparative genomics to demonstrate that carbohydrate and secondary metabolite transport functionalities are overrepresented within drought-enriched taxa. These data also reveal that bacterial iron transport and metabolism functionality is highly correlated with drought enrichment. Using time-series root RNA-Seq data, we demonstrate that iron homeostasis within the root is impacted by drought stress, and that loss of a plant phytosiderophore iron transporter impacts microbial community composition, leading to significant increases in the drought-enriched lineage, Actinobacteria. Finally, we show that exogenous application of iron disrupts the drought-induced enrichment of Actinobacteria, as well as their improvement in host phenotype during drought stress. Collectively, our findings implicate iron metabolism in the root microbiome's response to drought and may inform efforts to improve plant drought tolerance to increase food security.


Conflict of interest statement

The authors declare no competing interest.

Figures

Fig. 1
Fig. 1. Relative abundance profiles of microbial taxa in the sorghum rhizosphere under drought.
Percent relative abundance (y-axis) in the rhizosphere of the top 13 most abundant phyla for watered controls (a, c, e) and drought treatments (b, d, f) as measured by 16S rRNA gene amplicon sequencing (a, b), co-assembled contigs from shotgun metagenomic datasets (c, d), and all reads mapping to the 55 metagenome-assembled genomes (MAGs) (e, f). All five time points (TP3−TP10, shown on the x-axis) were selected based on the availability of data across all three data analysis types. All reads that mapped to other phyla or which were not classifiable at the phylum level are grouped into a fourteenth category, entitled Other. TP: time points.
Fig. 2
Fig. 2. Bacterial gene functional capacity enrichment in rhizosphere and soil under drought.
Bacteria gene ontology (GO) enrichment analysis for all genes derived from co-assembled contigs showing enrichment (panels one and two) or depletion (panels three and four) under drought for rhizospheres or soils at the peak of drought (TP8). The values on the x-axis indicate the fold enrichment ratio of the relative percentages of genes that are upregulated or downregulated under drought in each category relative to the total relative percentage of genes in the corresponding category within the entire dataset. Categories for which there were fewer than five differentially expressed genes were omitted. Solid circles indicate that the enrichment was significant (p-value of < = 0.05) in a one-sided hypergeometric test. Two categories discussed in more detail in the Results are shown in bold.
Fig. 3
Fig. 3. Phylogenetic tree of the 55 MAGs.
a The phylogenetic tree at the center of the figure was constructed from all 55 MAGs. Symbols located at the end of tree branches (inner ring) represent the estimated genome completeness of each MAG. Stars (black) indicate completeness greater than 90%; triangles (dark gray) represent completeness between 80 and 89.9%; squares (medium gray) indicate completeness between 70 and 79.9%; circles (light gray) indicate completeness between 60 and 69.9%. The colored middle ring represents the phylum each MAG belongs to. The outer ring of colored bars represents the relative log2 fold enrichment (orange) or depletion (green) of each MAG within drought-treated rhizosphere compared with watered control rhizosphere. The tree was re-rooted using an Archaeal outgroup clade. b Phylogenetic tree of 15 Actinobacterial MAGs pruned from the tree of 55 MAGs in (a). The label on the left represents the name of each MAG in the dataset. The bar plot at the right indicates the log2 fold enrichment under drought in the rhizosphere community. Dots to the right of a bar indicate non-significantly enriched MAGs, p-value > 0.05; asterisks to the right of the bar indicate significantly enriched MAGs, p-value < 0.05. The log2 fold enrichment and p values were calculated using edgeR.
Fig. 4
Fig. 4. GO enrichment analysis of enriched Actinobacterial metagenome-assembled genomes (MAGs) at the peak of drought in the rhizosphere.
GO enrichment analysis for all COGs showing enrichment within genomes of enriched Actinobacterial MAGs (n = 10) as compared with nonenriched Actinobacterial MAGs (n = 5) under drought for rhizosphere at time point 8 (TP8). The values on the x-axis indicate the fold enrichment ratio of the relative percentages of COGs upregulated under drought in each category relative to the total relative percentage of COGs in the corresponding category within the entire dataset. Solid (filled) circles indicate categories for which the enrichment had a p-value < 0.05 in a one-sided hypergeometric test and empty circles indicate categories with p values > 0.05.
Fig. 5
Fig. 5. Iron metabolism gene expression in sorghum roots under drought stress.
Log2 fold expression changes across time (x-axis) in drought-stressed root tissue for the approximately 234 expressed genes annotated as related to iron homeostasis (see Supplementary Data 3). Time points are indicated across the x-axis at the top, and drought (orange) and recovery (green) treatment stages are indicated above the time points. Hierarchical clustering analysis demonstrates two broad patterns of gene expression: a set of genes exhibiting strong downregulation under drought stress (indicated with purple tree branches), and a set of genes exhibiting strong upregulation under drought stress (indicated with pink tree branches). The five labeled genes on the right represent the genes investigated using qRT-PCR in the maize wild-type and tom1 mutant in the next section.
Fig. 6
Fig. 6. TOM1 deficiency in plants shapes the composition of the rhizosphere microbial community.
Constrained ordination of rhizosphere microbiome composition showing the effect of plant genotype (wild-type or tom1 mutant) under control (a) and drought (b) conditions. Ellipses show the parametric smallest area around the mean that contains 95% of the probability mass for each genotype. The p-value at the top of each plot represents the significance of the difference between WT and mutant, as evaluated by one-sided PERMANOVA. c The ratio of the relative abundance for Actinobacteria in tom1 vs. wild-type maize under control (left bar) and drought (right bar) conditions. d Relative abundance for the 13 most abundant bacterial phyla in the rhizosphere in both wild-type and tom1 mutant plants grown in the growth chamber for either 2.5 weeks of control (left facet) or drought (right facet) conditions. Significant differences in abundance between WT and the tom1 mutant under control conditions were determined by paired two-sided T-test, and are indicated with asterisks to the right of the phylum name: *, p < 0.05; **, p < 0.01; ***, p < 0.001.
Fig. 7
Fig. 7. Exogenous iron disrupts Streptomyces enrichment and reverses plant growth promotion capacity.
a Boxplot of the relative bacterial amount as measured using qPCR with lineage-specific primers across control (green) and drought-treated (orange) root samples in both Streptomyces ceolicolor Sc1 (upper panel) and Pseudomonas syringae (bottom panel) strains across two levels of iron application and a mock control (0 mM Fe3+). Values are means ± SD (n = 4) from four independent biological replicates. b Measurement of fresh root weight phenotypes upon application of two levels of Fe3+ and a mock control (0 mM Fe3+) causes a loss of root growth promoting phenotypes conferred by the Actinobacteria Streptomyces under drought (upper panel). No significant differences were observed under control conditions (lower panel). One-sided Tukey’s multiple-comparison tests were used for calculating the p values between different inoculations. Values are means ± SD (n = 7) from seven independent biological replicates. For both (a), (b), one-sided Tukey’s multiple-comparison tests were used for calculating the p values between different inoculations. Box bounds indicate one quartile above and below the mean, while whiskers indicate one standard deviation above the mean.
Fig. 8
Fig. 8. Model of interaction between iron, drought, and the root microbiome.
a During drought stress, sorghum experiences a decrease in photosynthesis and consequent reduced need for iron uptake by the root. Simultaneously, the surrounding soil environment becomes increasingly aerobic as water is removed from soil pores. b Increased soil aeration leads to reduced iron availability for plants and microbes, as iron becomes increasingly stored as insoluble Fe3+ (shown in red text). Simultaneously, due to decreased need for iron and increased levels of ROS present within root tissues, sorghum roots decrease expression of iron-uptake machinery, including TOM1, which exports the phytosiderophore mugenic acid (MA) to the rhizosphere to solubilize Fe3+ (shown in blue text). Collectively, this leads to less-solubilized iron in the rhizosphere, and decreased available iron within the root compartment. c The resulting low iron availability in root and rhizosphere environments promotes the growth of drought-enriched bacterial taxa (shown in blue) with high copy number of iron transport and metabolism-related genes, which are able to better scavenge the limited iron than drought-depleted lineages (shown in brown). This figure was created using Biorender.com.

Similar articles

Cited by

References

    1. Zhu J-K. Abiotic stress signaling and responses in plants. Cell. 2016;167:313–324. doi: 10.1016/j.cell.2016.08.029. - DOI - PMC - PubMed
    1. Becklin KM, et al. Examining plant physiological responses to climate change through an evolutionary lens. Plant Physiol. 2016;172:635–649. - PMC - PubMed
    1. Schimel JP. Life in dry soils: effects of drought on soil microbial communities and processes. Annu. Rev. Ecol. Evol. Syst. 2018;49:409–432. doi: 10.1146/annurev-ecolsys-110617-062614. - DOI
    1. Gupta A, Rico-Medina A, Caño-Delgado AI. The physiology of plant responses to drought. Science. 2020;368:266–269. doi: 10.1126/science.aaz7614. - DOI - PubMed
    1. Lau JA, Lennon JT. Rapid responses of soil microorganisms improve plant fitness in novel environments. Proc. Natl Acad. Sci. USA. 2012;109:14058–14062. doi: 10.1073/pnas.1202319109. - DOI - PMC - PubMed

Publication types