. 2021 Nov;28(11):3176-3192.
doi: 10.1038/s41418-021-00810-2. Epub 2021 May 28.

CBFβ promotes colorectal cancer progression through transcriptionally activating OPN, FAM129A, and UPP1 in a RUNX2-dependent manner

Affiliations

CBFβ promotes colorectal cancer progression through transcriptionally activating OPN, FAM129A, and UPP1 in a RUNX2-dependent manner

Chen Wang et al. Cell Death Differ. 2021 Nov.

Abstract

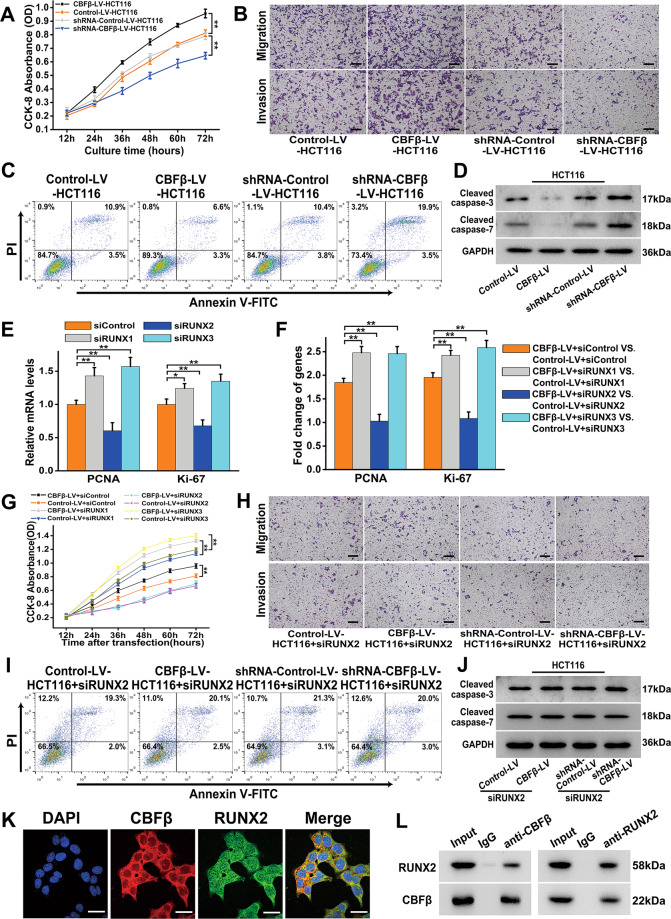
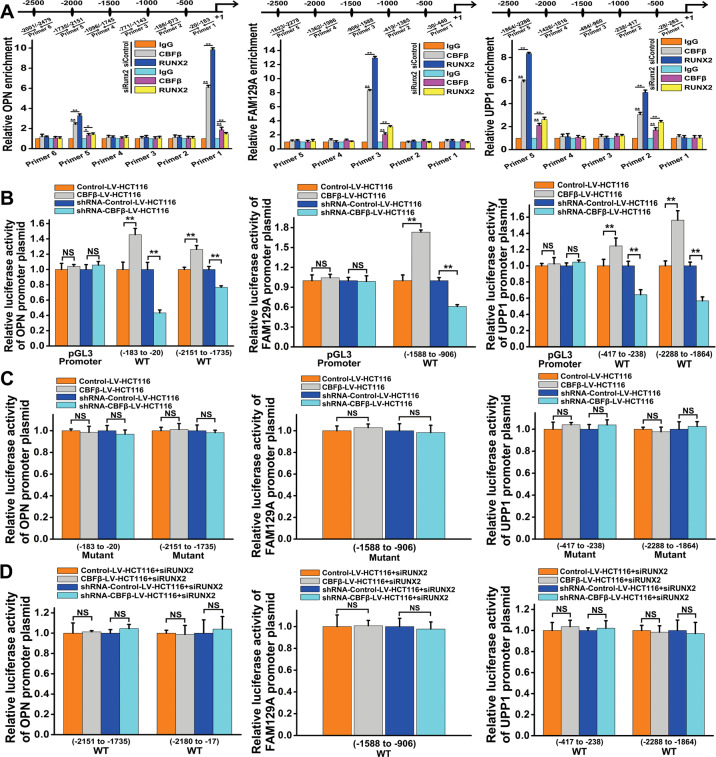
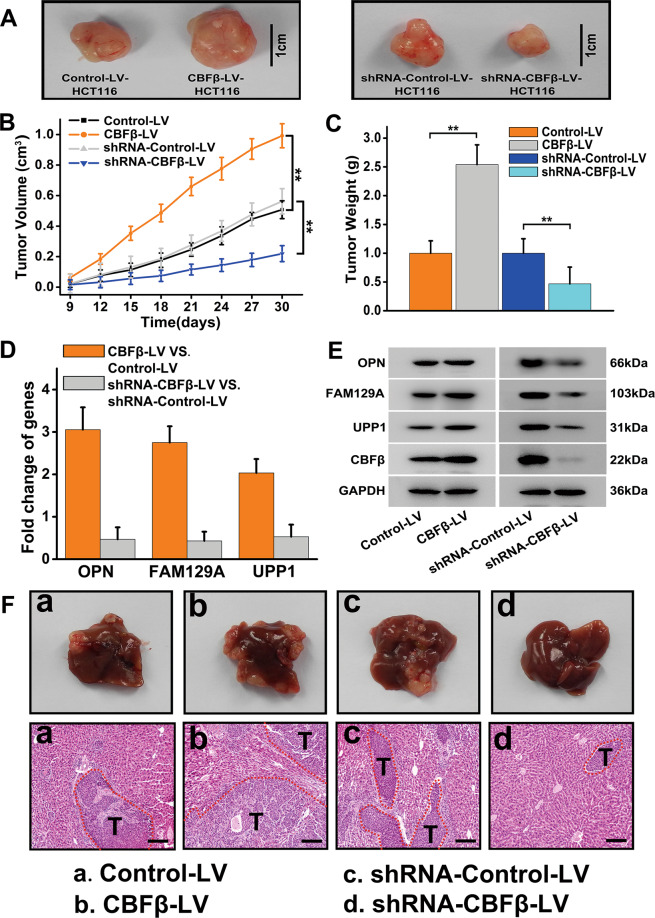
Colorectal cancer (CRC) is commonly associated with aberrant transcription regulation, but characteristics of the dysregulated transcription factors in CRC pathogenesis remain to be elucidated. In the present study, core-binding factor β (CBFβ) is found to be significantly upregulated in human CRC tissues and correlates with poor survival rate of CRC patients. Mechanistically, CBFβ is found to promote CRC cell proliferation, migration, invasion, and inhibit cell apoptosis in a RUNX2-dependent way. Transcriptome studies reveal that CBFβ and RUNX2 form a transcriptional complex that activates gene expression of OPN, FAM129A, and UPP1. Furthermore, CBFβ significantly promotes CRC tumor growth and live metastasis in a mouse xenograft model and a mouse liver metastasis model. In addition, tumor-suppressive miR-143/145 are found to inhibit CBFβ expression by specifically targeting its 3'-UTR region. Consistently, an inverse correlation between miR-143/miR-145 and CBFβ expression levels is present in CRC patients. Taken together, this study uncovers a novel regulatory role of CBFβ-RUNX2 complex in the transcriptional activation of OPN, FAM129A, and UPP1 during CRC development, and may provide important insights into CRC pathogenesis.


Conflict of interest statement

The authors declare no competing interests.

Figures

Fig. 1
Fig. 1. Upregulation of CBFβ in colorectal cancer is associated with poor prognosis.
A Representative photos of H&E staining and IHC staining of CBFβ protein in normal, well-differentiated, moderately differentiated, and poorly differentiated colorectal cancer tissues (magnification: ×40, scale bar = 250 μm; and magnification: ×200, scale bar = 50 μm). B Total IHC score of CBFβ in NAT and CRC tissues (n = 180, two-tailed Student’s t test). C IHC score of CBFβ in normal, well-differentiated, moderately differentiated, and poorly differentiated colorectal cancer tissues (one-way ANOVA with post hoc Bonferroni correction). D Kaplan–Meier curves of overall survival of 180 patients with colorectal cancer, stratified by CBFβ expression. E Western blot analysis of CBFβ in NAT and CRC tissues (n = 54). GAPDH served as a loading control. F Quantification of the CBFβ protein bands compared to the GAPDH band from western blot of NAT and CRC tissues (n = 54), using ImageJ software for protein densitometric analysis (two-tailed Student’s t test). Values are expressed as the mean ± SEM. *P < 0.05, **P < 0.01, ***P < 0.001.
Fig. 2
Fig. 2. RUNX1-3 expression in CRC patients.
A Representative photos of H&E staining and IHC staining of RUNX1, RUNX2, and RUNX3 proteins in paired NAT and CRC tissues (magnification: ×40, scale bar = 250 μm; and magnification: ×200, scale bar = 50 μm). B Total IHC scores of RUNX1, RUNX2, and RUNX3 in NAT and CRC tissues (n = 75, two-tailed Student’s t test). C Western blot analysis of RUNX1, RUNX2, and RUNX3 in NAT and CRC tissues (n = 10). GAPDH served as a loading control. D Quantification of the RUNX1, RUNX2, and RUNX3 protein bands compared to the GAPDH band from western blot in NAT and CRC tissues using ImageJ software for protein densitometric analysis (n = 10, two-tailed Student’s t test). Values are expressed as the mean ± SEM. **P < 0.01.
Fig. 3
Fig. 3. CBFβ promotes CRC cell proliferation, migration, invasion, and inhibits CRC cell apoptosis in a RUNX2-dependent manner.
A Growth curves of stable HCT116 cells with overexpression or knockdown of CBFβ (CBFβ-LV/shRNA-CBFβ-LV groups) compared with their control cells (Control-LV/shRNA-Control-LV groups). Cell growth was measured using the CCK-8 assay (n = 5, two-tailed Student’s t test). B Migration and invasion of CBFβ-LV/shRNA-CBFβ-LV-HCT116 cells and their control cells were examined by transwell assays after cells were plated and incubated for 12 h. One representative of three reproducible experiments is shown (scale bar = 100 μm). C Apoptosis of CBFβ-LV/shRNA-CBFβ-LV-HCT116 cells and their control cells was examined by flow cytometry. One representative of three reproducible experiments is shown. D Western blot analysis of cleaved caspase-3/7 protein in CBFβ-LV/shRNA-CBFβ-LV-HCT116 cells and their control cells. E Relative mRNA levels of PCNA and Ki-67 in HCT116 cells at 36 h after transfection with siRUNX1, siRUNX2, and siRUNX3 compared to the cells transfected with siControl (one-way ANOVA with the Dunnett’s test). F Fold changes of mRNA levels of PCNA and Ki-67 in CBFβ-LV and Control-LV-HCT116 cells at 36 h after transfection with siRUNX1, siRUNX2, siRUNX3 or siControl (one-way ANOVA with the Dunnett’s test). G Growth curves of CBFβ-LV and Control-LV-HCT116 cells after transfection with siRUNX1, siRUNX2, siRUNX3, or siControl. Cell growth was measured using the CCK-8 assay (n = 5, one-way ANOVA with post hoc Bonferroni correction). H Migration and invasion of CBFβ-LV/shRNA-CBFβ-LV-HCT116 cells and their control cells at 24 h post transfection with siRUNX2 were examined by transwell assays after transfected cells were plated and incubated for 12 h. One representative photo of three reproducible experiments is shown (scale bar = 100 μm). I Apoptosis of CBFβ-LV/shRNA-CBFβ-LV-HCT116 cells and their control cells at 36 h after transfection with siRUNX2 was examined by flow cytometry. One representative of three reproducible experiments is shown. J Western blot analysis of cleaved caspase-3/7 proteins in CBFβ-LV/shRNA-CBFβ-LV-HCT116 cells and their control cells at 36 h after transfection with siRUNX2. K Representative photos of immunofluorescence staining for CBFβ and RUNX2 (red, CBFβ; green, RUNX2; blue, DAPI nuclear staining). Pictures were imaged at ×40 magnification on a Nikon confocal microscope. Scale bar, 50 mm. L Coimmunoprecipitation of RUNX2 after pull down of the CBFβ protein complex (left) and coimmunoprecipitation of CBFβ after pull down of the RUNX2 protein complex (right) in HCT116 cells. One representative result of three experiments is shown. Values are expressed as the mean ± SEM. *P < 0.05; **P < 0.01.
Fig. 4
Fig. 4. CBFβ-RUNX2 complex promotes mRNA and protein expression of OPN, FAM129A, and UPP1 in CRC cells.
A Intersection analysis of differently expressed genes both in CBFβ-LV-HCT116 and shRNA-CBFβ-LV-HCT116 cells. B Intersection analysis of CBFβ-dependent transcripts measured by RNA-seq and RUNX2-bound genes measured by ChIP-seq in HCT116 cells. C Fold changes of mRNA levels of OPN, FAM129A, and UPP1 in CBFβ-LV/shRNA-CBFβ-LV-HCT116 cells compared with their control cells (two-tailed Student’s t test). D Fold changes of mRNA levels of OPN, FAM129A, and UPP1 in CBFβ-LV/shRNA-CBFβ-LV-HCT116 cells compared with their control cells after transfection with siRUNX2 for 36 h (two-tailed Student’s t test). E Western blot analysis of OPN, FAM129A, and UPP1 protein in Control-LV, CBFβ-LV-HCT116 cells (left), shRNA-Control-LV, shRNA-CBFβ-LV-HCT116 cells (middle), and in HCT116 cells after transfection with siControl or siRUNX2 for 36 h (right). F Western blot analysis of OPN, FAM129A, and UPP1 proteins in CBFβ-LV and Control-LV-HCT116 cells after transfection with siControl or siRUNX2 for 36 h. Values are expressed as the mean ± SEM.
Fig. 5
Fig. 5. Binding sites of CBFβ-RUNX2 complex in the promoter regions of OPN, FAM129A, and UPP1 were identified in CRC cells.
A The enrichment of OPN, FAM129A, and UPP1 promoter fragments precipitated by CBFβ or RUNX2 antibody, which was demonstrated by chromatin immunoprecipitation (ChIP) analysis. Further experiments were performed when simultaneously inhibiting RUNX2. Rabbit IgG served as a control (one-way ANOVA with post hoc Bonferroni correction). B The parental pGL3 reporter and the modified pGL3 reporters containing the predicted binding sites of RUNX2 on the promoters of OPN, FAM129A, and UPP1 were transfected in CBFβ-LV/shRNA-CBFβ-LV-HCT116 cells and their control cells. After 24 h, the reporter activity was measured using a luciferase assay. C The reporter activity was measured after transfection with the plasmids, in which the predicted binding sites of RUNX2 on the promoters of OPN, FAM129A, and UPP1 were mutated. D The reporter activity was measured after cotransfection with siRNA for RUNX2 and modified pGL3 reporters containing the predicted binding sites of RUNX2 on the promoters of OPN, FAM129A, and UPP1 simultaneously (B–D: two-tailed Student’s t test). Values are expressed as the mean ± SEM. *P < 0.05; **P < 0.01; NS, no significance.
Fig. 6
Fig. 6. CBFβ promotes colorectal tumor growth and liver metastasis in vivo.
A Representative photographs of xenograft tumors derived from nude mice with subcutaneous implantation of CBFβ-LV/shRNA-CBFβ-LV-HCT116 cells or their control cells. The volumes (left) and weights (right) of the xenograft tumors derived from nude mice with subcutaneous implantation of CBFβ-LV/shRNA-CBFβ-LV-HCT116 cells or their control cells (B, C: two-tailed Student’s t test). D Fold changes of mRNA levels of OPN, FAM129A, and UPP1 in xenograft tumors from nude mice (two-tailed Student’s t test). E Western blot analysis of OPN, FAM129A, UPP1, and CBFβ proteins in xenograft tumors from nude mice. F Representative photographs and H&E staining images of livers derived from nude mice with spleen injection of CBFβ-LV/shRNA-CBFβ-LV-HCT116 cells or their control cells. T tumor region. One representative result of three experiments is shown (scale bar = 100 μm). Values are expressed as the mean ± SEM. **P < 0.01.
Fig. 7
Fig. 7. MiR-143 and miR-145 directly regulate CBFβ expression at the posttranscriptional level in CRC.
A qRT-PCR analysis of CBFβ mRNA level in 54 pairs of CRC and NAT samples (two-tailed Student’s t test). B Direct recognition of the CBFβ 3′-UTR by miR-143/145. HCT116 cells were cotransfected with firefly luciferase reporters containing either wild-type (WT) or mutant miR-143/145 binding sites in the CBFβ 3′-UTR and pre-scramble, pre-miR-143, pre-miR-145, pool of pre-miR-143 and pre-miR-145, anti-scramble, anti-miR-143, anti-miR-145, or pool of anti-miR-143 and anti-miR-145. The cells were evaluated using a luciferase assay kit after 24 h. The results are displayed as the ratio of firefly luciferase activity in the miR-143/145-transfected cells compared to the activity in the control cells (one-way ANOVA with the Dunnett’s test). C Western blot analysis of CBFβ protein level and D qRT-PCR analysis of relative CBFβ mRNA level in HCT116 cells treated with pre-scramble, pre-miR-143, pre-miR-145, or pool of pre-miR-143 and pre-miR-145, and in cells treated with anti-scramble, anti-miR-143, anti-miR-145, or pool of anti-miR-143 and anti-miR-145. E qRT-PCR analysis of the expression levels of miR-143 (up) and miR-145 (down) in NAT and CRC tissues (n = 54) shown as line charts. U6 small nuclear RNA was used as an internal control to normalize expression data (two-tailed Student’s t test). F Pearson’s correlation scatter plot showing the fold changes in expression of CBFβ protein and miR-143 (up) or miR-145 (down) in CRC patients (n = 54). The correlation coefficient (R) is shown. G The protein levels of OPN, FAM129A, and UPP1 in CBFβ-LV-HCT116 and Control-LV-HCT116 cells after transfection with pre-scramble, pre-miR-143, pre-miR-145, or pool of pre-miR-143 and pre-miR-145. H Schematic diagram of miR-143/145-targeted CBFβ to promote CRC progression through transcriptionally activating OPN, FAM129A, and UPP1 in a RUNX2-dependent manner. Values are expressed as the mean ± SEM. **P < 0.01.

Similar articles

Cited by

References

    1. Siegel RL, Miller KD, Goding Sauer A, Fedewa SA, Butterly LF, Anderson JC, et al. Colorectal cancer statistics, 2020. CA Cancer J Clin. 2020;70:145–64. doi: 10.3322/caac.21601. - DOI - PubMed
    1. Dienstmann R, Vermeulen L, Guinney J, Kopetz S, Tejpar S, Tabernero J. Consensus molecular subtypes and the evolution of precision medicine in colorectal cancer. Nat Rev Cancer. 2017;17:79–92. doi: 10.1038/nrc.2016.126. - DOI - PubMed
    1. Walther A, Johnstone E, Swanton C, Midgley R, Tomlinson I, Kerr D. Genetic prognostic and predictive markers in colorectal cancer. Nat Rev Cancer. 2009;9:489–99. doi: 10.1038/nrc2645. - DOI - PubMed
    1. Xie B, Bai B, Xu Y, Liu Y, Lv Y, Gao X, et al. Tumor-suppressive function and mechanism of HOXB13 in right-sided colon cancer. Signal Transduct Target Ther. 2019;4:51. doi: 10.1038/s41392-019-0086-1. - DOI - PMC - PubMed
    1. Su L, Luo Y, Yang Z, Yang J, Yao C, Cheng F, et al. MEF2D transduces microenvironment stimuli to ZEB1 to promote epithelial-mesenchymal transition and metastasis in colorectal cancer. Cancer Res. 2016;76:5054–67. doi: 10.1158/0008-5472.CAN-16-0246. - DOI - PubMed

Publication types

MeSH terms

Substances