Multicenter Study
. 2021 Nov;31(11):8317-8325.
doi: 10.1007/s00330-021-08067-6. Epub 2021 May 28.

Variation in arterial input function in a large multicenter computed tomography perfusion study

Collaborators, Affiliations
Multicenter Study

Variation in arterial input function in a large multicenter computed tomography perfusion study

Daan Peerlings et al. Eur Radiol. 2021 Nov.

Abstract

Objectives: To report the variation in computed tomography perfusion (CTP) arterial input function (AIF) in a multicenter stroke study and to assess the impact this has on CTP results.

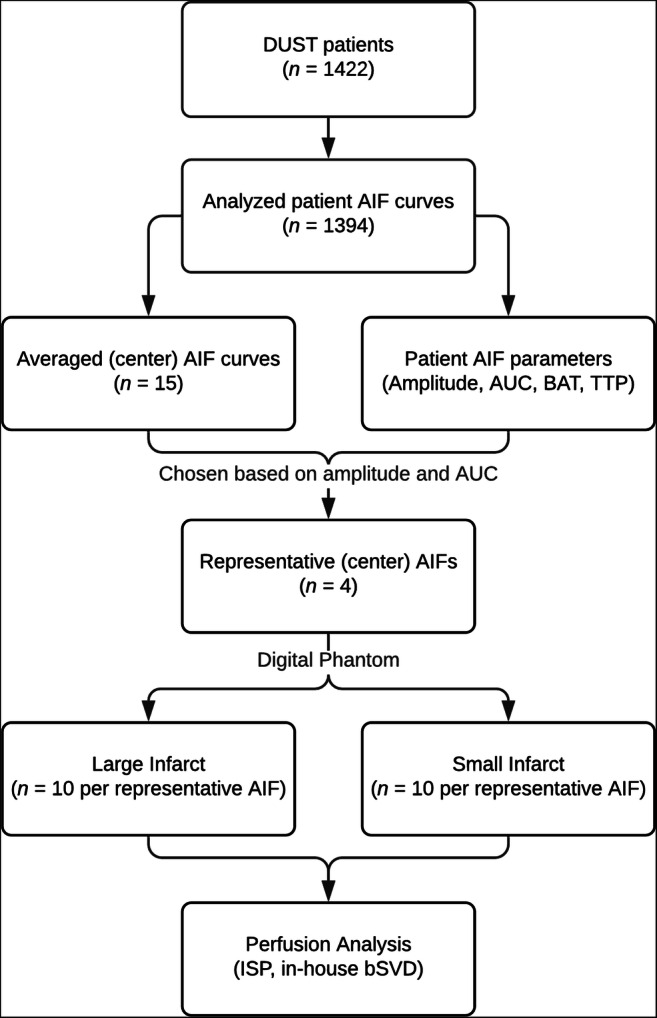
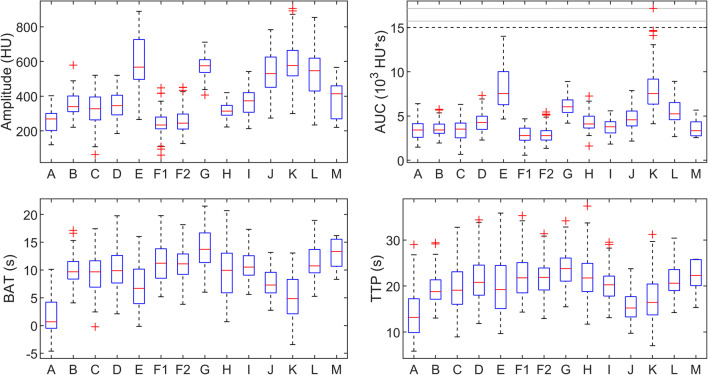
Methods: CTP datasets from 14 different centers were included from the DUtch acute STroke (DUST) study. The AIF was taken as a direct measure to characterize contrast bolus injection. Statistical analysis was applied to evaluate differences in amplitude, area under the curve (AUC), bolus arrival time (BAT), and time to peak (TTP). To assess the clinical relevance of differences in AIF, CTP acquisitions were simulated with a realistic anthropomorphic digital phantom. Perfusion parameters were extracted by CTP analysis using commercial software (IntelliSpace Portal (ISP), version 10.1) as well as an in-house method based on block-circulant singular value decomposition (bSVD).

Results: A total of 1422 CTP datasets were included, ranging from 6 to 322 included patients per center. The measured values of the parameters used to characterize the AIF differed significantly with approximate interquartile ranges of 200-750 HU for the amplitude, 2500-10,000 HU·s for the AUC, 0-17 s for the BAT, and 10-26 s for the TTP. Mean infarct volumes of the phantom were significantly different between centers for both methods of perfusion analysis.

Conclusions: Although guidelines for the acquisition protocol are often provided for centers participating in a multicenter study, contrast medium injection protocols still vary. The resulting volumetric differences in infarct core and penumbra may impact clinical decision making in stroke diagnosis.

Key points: • The contrast medium injection protocol may be different between stroke centers participating in a harmonized multicenter study. • The contrast medium injection protocol influences the results of X-ray computed tomography perfusion imaging. • The contrast medium injection protocol can impact stroke diagnosis and patient selection for treatment.

Keywords: Contrast media; Perfusion imaging; Stroke; Tomography, X-ray computed.


Conflict of interest statement

The authors of this manuscript declare no relationships with any companies whose products or services may be related to the subject matter of the article.

Figures

Fig. 1
Fig. 1
Flowchart of our study. AIF stands for arterial input function, AUC stands for area under the curve, BAT stands for bolus arrival time, and TTP stands for time to peak
Fig. 2
Fig. 2
The considered parameters of the arterial input function: amplitude, area under the curve (AUC), bolus arrival time (BAT), and time to peak (TTP). The BAT is defined as the left 0.05% percentile of the maximum of the gamma distribution curve
Fig. 3
Fig. 3
Boxplots of the parameters characterizing the arterial input function per stroke center. Outliers are depicted as red crosses. Extreme values were clipped, retaining the relative order, to avoid compressed boxplots
Fig. 4
Fig. 4
The average arterial input function (AIF) per stroke center. The four colored curves served as input for an anthropomorphic digital phantom. The dotted black curves are the AIFs of the other centers. Red curves have comparable AUCs and blue curves comparable widths. Light curves have a low amplitude and dark curves a high amplitude
Fig. 5
Fig. 5
Parameter maps of one of the noise realizations of the anthropomorphic digital phantom with a small infarct for each of the four selected arterial input functions obtained from ISP. The cerebral blood flow (CBF; upper row) is in mL/100g/min, the cerebral blood volume (CBV; middle row) in mL/100g, and the mean transit time (MTT; bottom row) in seconds
Fig. 6
Fig. 6
Boxplots of the estimated core and penumbra volumes for a small infarct (8-mL core and 48-mL penumbra) and a large infarct (26-mL core and 243-mL penumbra) obtained from ISP (upper row) and the in-house software (bottom row) for the representative centers. Outliers are depicted as red crosses

References

    1. Borst J, Berkhemer OA, Roos YBWEM, et al. Value of computed tomographic perfusion-based patient selection for intra-arterial acute ischemic stroke treatment. Stroke. 2015;46:3375–3382. doi: 10.1161/STROKEAHA.115.010564. - DOI - PubMed
    1. Nogueira RG, Jadhav AP, Haussen DC, et al. Thrombectomy 6 to 24 hours after stroke with a mismatch between deficit and infarct. N Engl J Med. 2018;378:11–21. doi: 10.1056/NEJMoa1706442. - DOI - PubMed
    1. Albers GW, Marks MP, Kemp S, et al. Thrombectomy for stroke at 6 to 16 hours with selection by perfusion imaging. N Engl J Med. 2018;378:708–718. doi: 10.1056/NEJMoa1713973. - DOI - PMC - PubMed
    1. Kudo K, Christensen S, Sasaki M, et al. Accuracy and reliability assessment of CT and MR perfusion analysis software using a digital phantom. Radiology. 2013;267:201–211. doi: 10.1148/radiol.12112618. - DOI - PMC - PubMed
    1. Dani KA, Thomas RGR, Chappell FM, et al. Computed tomography and magnetic resonance perfusion imaging in ischemic stroke: definitions and thresholds. Ann Neurol. 2011;70:384–401. doi: 10.1002/ana.22500. - DOI - PubMed

Publication types

LinkOut - more resources