. 2021 Jul 7;109(13):2091-2105.e6.
doi: 10.1016/j.neuron.2021.05.003. Epub 2021 May 28.

Resolving cellular and molecular diversity along the hippocampal anterior-to-posterior axis in humans

Affiliations

Resolving cellular and molecular diversity along the hippocampal anterior-to-posterior axis in humans

Fatma Ayhan et al. Neuron. .

Abstract

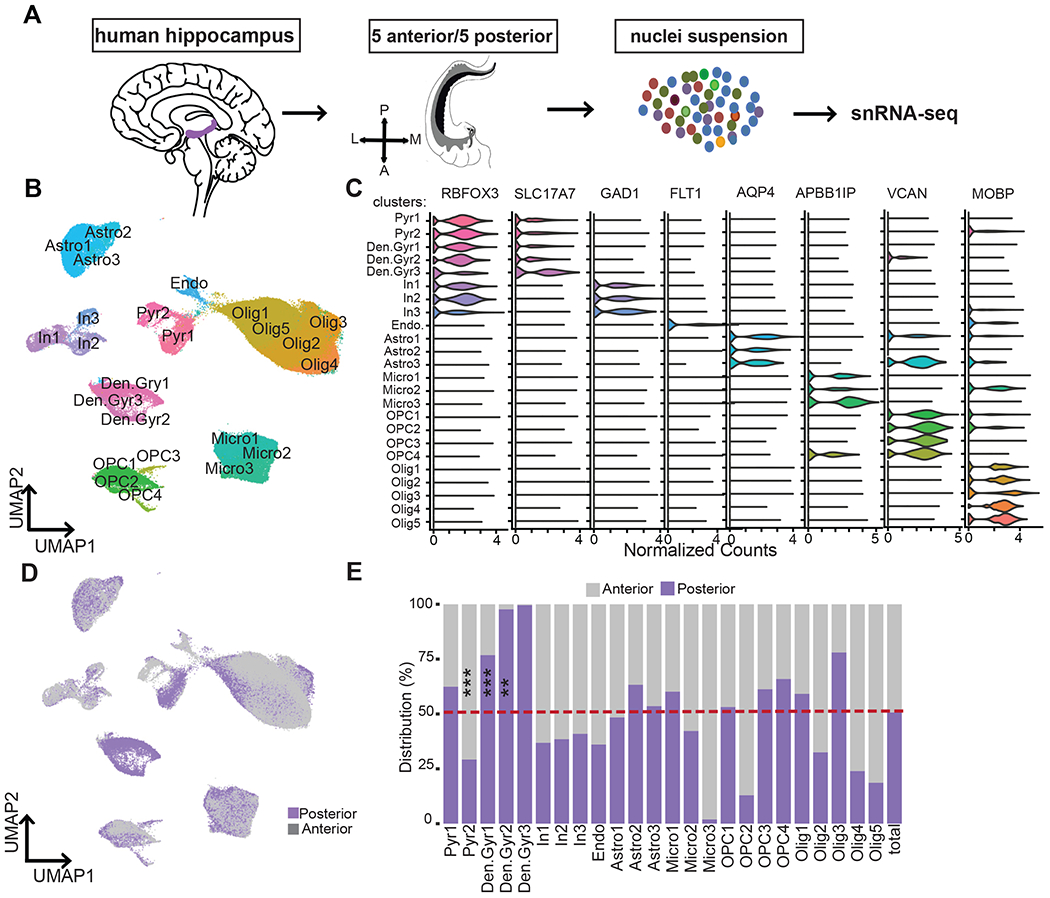
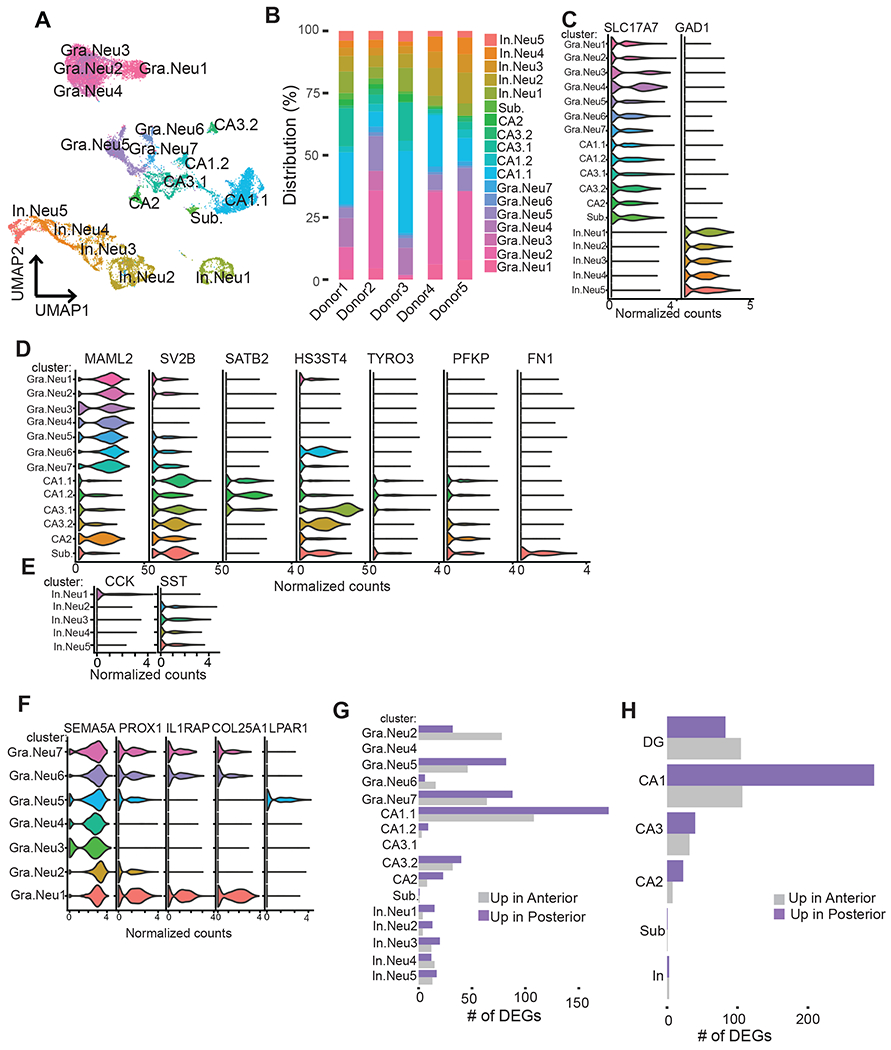
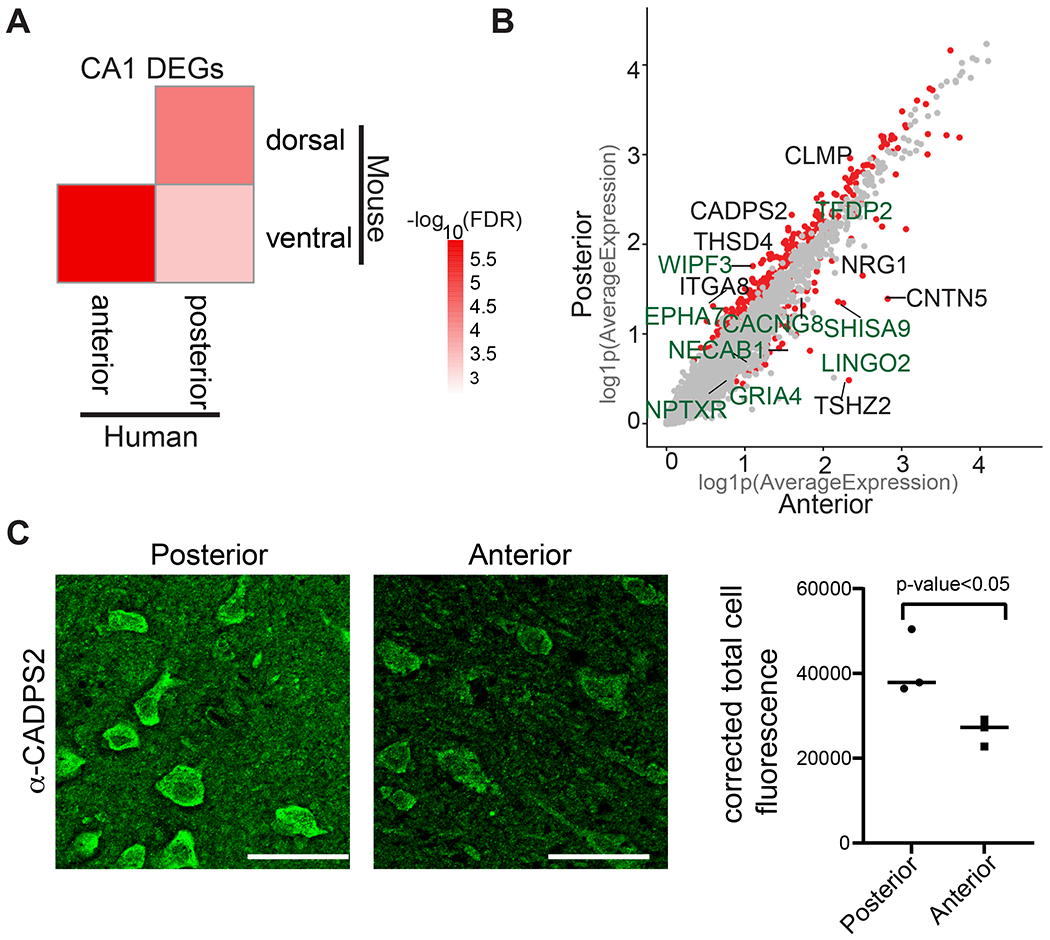
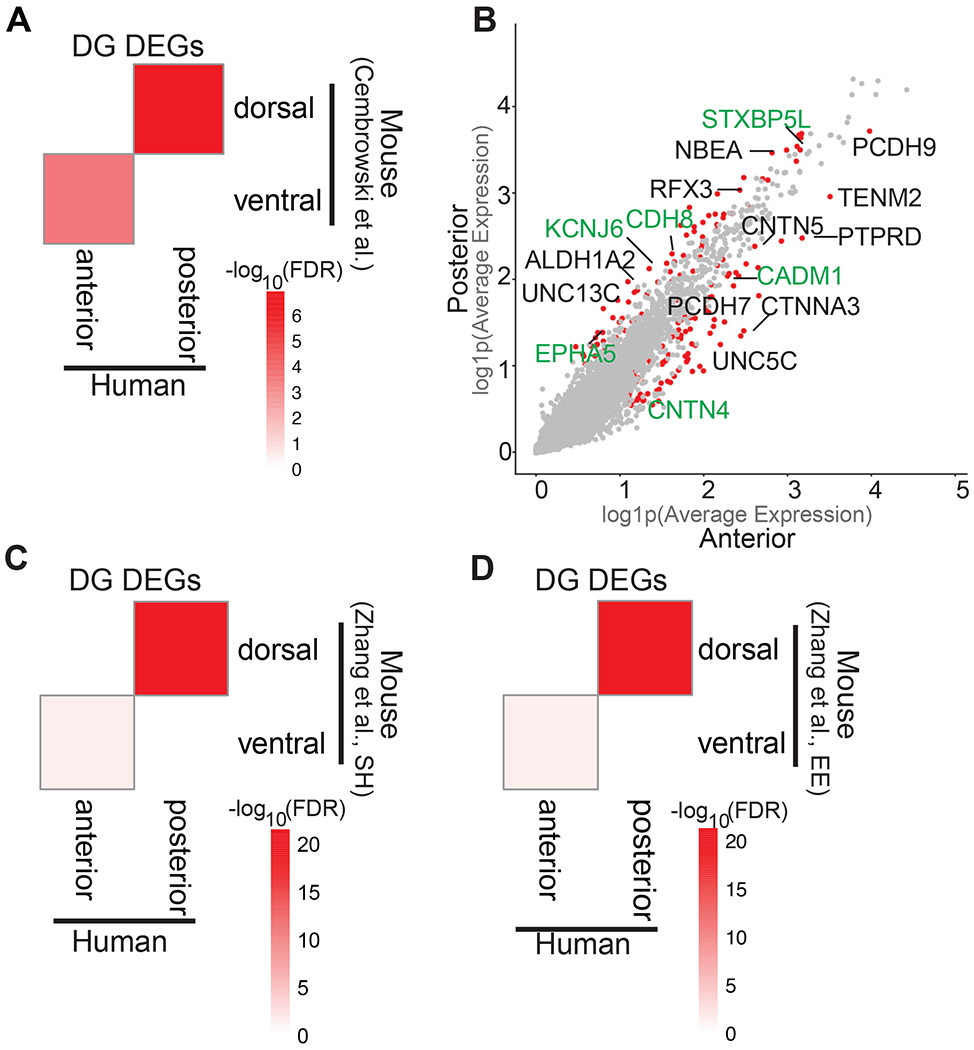
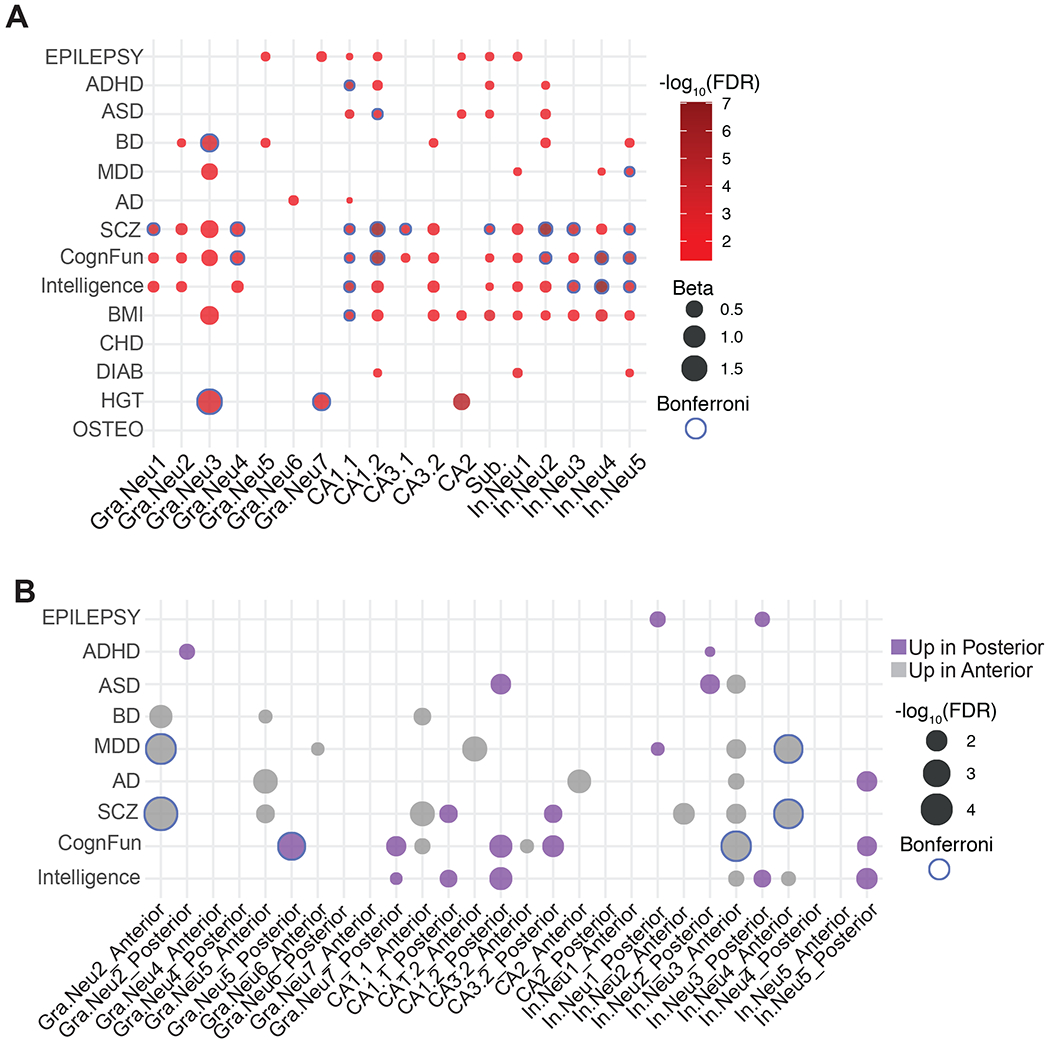
The hippocampus supports many facets of cognition, including learning, memory, and emotional processing. Anatomically, the hippocampus runs along a longitudinal axis, posterior to anterior in primates. The structure, function, and connectivity of the hippocampus vary along this axis. In human hippocampus, longitudinal functional heterogeneity remains an active area of investigation, and structural heterogeneity has not been described. To understand the cellular and molecular diversity along the hippocampal long axis in human brain and define molecular signatures corresponding to functional domains, we performed single-nuclei RNA sequencing on surgically resected human anterior and posterior hippocampus from epilepsy patients, identifying differentially expressed genes at cellular resolution. We further identify axis- and cell-type-specific gene expression signatures that differentially intersect with human genetic signals, identifying cell-type-specific genes in the posterior hippocampus for cognitive function and the anterior hippocampus for mood and affect. These data are accessible as a public resource through an interactive website.

Keywords: hippocampus, single-cell genomics, cognition, memory, neurogenomics.


Conflict of interest statement

Declaration of interests The authors declare no competing interests.

Figures

Figure 1.
Figure 1.. Unbiased snRNA-seq analysis identified 24 distinct cell types in human anterior and posterior hippocampus samples
(A) Schematic overview of the experimental procedures used to extract nuclei from 5 anterior and 5 posterior samples, single-nuclei capture and barcoding using 10X Genomics Chromium, and Illumina next-generation sequencing. (B) UMAP plot of all cells analyzed from anterior (64,076) and posterior (65,832) hippocampus, colored by cluster identities and cell-type annotations. Pyr=Pyramidal neurons, Den.Gyr=dentate gyrus neurons, In=Interneurons, Endo=endothelial cells, Micro=microglia, Astro=astrocytes, OPCs=oligodendrocyte progenitor cells, and Olig=oligodendrocytes. (C) Violin plots of expression values for cell-type-specific marker genes. (D) UMAP plot of all cells analyzed, colored by the axis the cells were recovered from (posterior, purple; anterior, gray). (E) Bar chart showing the frequency distribution of all clusters between posterior (purple) and anterior (gray). *P < 0.01, ***P < 0.001, Robust generalized mixed model. See also Figure S2, S3, S4, and S5 and Table S2, S3.
Figure 2.
Figure 2.. snRNA-seq reveals neuronal cell heterogeneity and DEGs across the hippocampal poles.
(A) UMAP plot of neuronal cells colored by cluster identities and cell-type annotations. (B) Frequency distribution of neuronal clusters in five donors. (C) Violin plots of expression values for markers for excitatory and inhibitory neurons, (D) for subfields markers, and (E) for inhibitory neuronal cell types across clusters. (F) Violin plots showing the normalized counts of shared and distinct markers (x-axis) of DG clusters (y-axis). (G) Within cluster differential gene expression analysis between anterior vs. posterior (adj. p-value<0.05, log2FC>0.3, percentage>25). (H) Within cell-type differential gene expression analysis between anterior vs. posterior (adj. p-value<0.05, log2FC>0.3, percentage>25). Gra.Neu=Granule Neurons, In.Neu=Inhibitory neurons, and Sub=subiculum. See also Figure S6, S7, S8, S9, S10 and Table S4, S5, S6, S7.
Figure 3.
Figure 3.. Differential gene expression in CA1 neurons in anterior and posterior hippocampus.
(A) Heatmap showing −log10(FDR) from a hypergeometric enrichment test for the overlaps between mouse CA1 dorsal-ventral enriched genes described in Cembrowski et al. (Cembrowski et al., 2016a) with human CA1 genes enriched in the anterior and posterior hippocampus. (B) Scatter plot showing log(1+x) (log1p) of the average expression for each gene in CA1 neurons in anterior (x-axis) and posterior (y-axis). Red dots represent the genes that are significantly differentially expressed across anterior CA1 vs posterior CA1 (adj. p-value<0.05, log2FC>0.3, percentage>25); gray dots represent the genes that are not differentially expressed. The names of genes that are differentially expressed both in mouse and human across the long axis are labeled green. The names of genes that are differentially expressed across the axis only in human are labeled black. (C) Immunohistochemistry demonstrates greater protein levels of CADPS2 in posterior compared to anterior hippocampus. Left panel: representative image of immunohistochemistry using α-CADPS2 in posterior or anterior hippocampal tissue. Right panel: quantification of corrected total cell fluorescence from immunohistochemistry using α-CADPS2 in posterior compared to anterior hippocampus. Individual points represent the average intensity values derived from each specimen (n=3, P< 0.05; unpaired t test). See also Figure S11 and Table S8, S9.
Figure 4.
Figure 4.. Transcriptomic and cellular heterogeneity of dentate gyrus granule cells in the hippocampus.
(A) Heatmap showing −log10(FDR) from a hypergeometric enrichment test for the overlaps between mouse DG dorsal-ventral enriched genes described in Cembrowski et al. (Cembrowski et al., 2016b) with human DG genes enriched in the anterior and posterior hippocampus. (B) Scatter plot showing log(1+x) (log1p) of the average expression for each gene in dentate gyrus (DG) granule neurons in anterior (x-axis) and posterior (y-axis). Red dots represent the genes that are significantly differentially expressed across anterior DG vs posterior DG (adj. p-value<0.05, log2FC>0.3, percentage>25); gray dots represent the genes that are not differentially expressed. The names of genes that are differentially expressed both in mouse and human across the long axis are labeled green. The names of genes that are differentially expressed across the axis only in human are labeled black. (C) Heatmap showing −log10(FDR) from a hypergeometric enrichment test for the overlaps between mouse DG dorsal-ventral enriched genes under standard housing environment described in Zhang et. al. (D) Heatmap showing −log10 (FDR) from a hypergeometric enrichment test for the overlaps between mouse DG dorsal-ventral enriched genes under enriched environment described in Zhang et. al (Zhang et al., 2018). SH= standard housing, EE=enriched environment. See also Table S8, S9.
Figure 5.
Figure 5.. Enrichment of neuropsychiatric and cognitive trait variants to genes expressed in aHP and pHP.
(A) GWAS enrichment in cluster markers. Bubble-chart highlighting the enrichment of human GWAS signals in the neuronal cluster marker genes identified in this study. Association analysis was performed using MAGMA. Gradient corresponds to the −log10(FDR) for each association test. Size corresponds to the effect size (Beta). Blue border corresponds to the Bonferroni correction threshold of p < 0.05. Y-axis lists the acronyms for the traits and diseases utilized for this analysis. X-axis lists the neuronal clusters with the corresponding cell-type annotation. (B) GWAS enrichment in cluster-specific DEGs. Bubble-chart highlighting the −log10(FDR) for the enrichment of human GWAS signal in the cluster-specific DEGs across aHP and pHP. Blue border corresponds to the Bonferroni correction threshold of p < 0.05. The y-axis shows the acronyms for the GWAS data utilized for this analysis. The x-axis shows aHP vs pHP DEGs in each cluster (Cluster#_Anterior=the list of genes expressed at higher levels in aHP in the given cluster, Cluster#_Posterior=the list of genes expressed at higher levels in pHP in the given cluster). ADHD=attention deficit hyperactivity disorder, ASD=autism spectrum disorders, AD=Alzheimer’s disease, BD=bipolar disorder, MDD=major depressive disorder, SCZ=schizophrenia, CognFunc=cognitive functions, BMI=body mass index, CHD=coronary artery disease, DIAB=diabetes, HGT=height, and OSTEO=osteoporosis. See also Table S10.
Figure 6.
Figure 6.. Transcriptomic and cellular heterogeneity of glial cells in the hippocampus.
(A) Heatmap illustrating the average expression of the top 5 DEGs between astrocyte clusters. Color scheme corresponds to log-normalized and scaled values for average gene expression for each cluster. (B) Frequency distribution of astrocyte clusters in five donors. (C) Heat map illustrates −log10(FDR) of gene set enrichment (hypergeometric test) between the mouse astrocyte cluster marker genes with human astrocyte cluster marker genes. The x-axis lists the astrocyte populations identified in mouse (Batiuk et al., 2020). The y-axis lists the astrocyte clusters identified in this study. (D) Frequency distribution of oligodendrocyte clusters in five donors. (E) UMAP showing reclustering of oligodendrocytes independent of the rest of the dataset. (F) Frequency distribution of separately analyzed oligodendrocytes clusters in five donors. (G) Violin plots of normalized counts for mature and precursor oligodendrocyte marker genes. (H) Heat map illustrates −log10(FDR) of gene set enrichment (hypergeometric test) between the markers for oligodendrocyte types identified in human cortex (Jakel et al., 2019) and the markers for the oligodendrocyte clusters identified in this study. See also Figure S12, S13.

Similar articles

Cited by

References

    1. Anderson AG, Kulkarni A, Harper M, and Konopka G (2020). Single-Cell Analysis of Foxp1-Driven Mechanisms Essential for Striatal Development. Cell Rep 30, 3051–3066 e3057. - PMC - PubMed
    1. Batiuk MY, Martirosyan A, Wahis J, de Vin F, Marneffe C, Kusserow C, Koeppen J, Viana JF, Oliveira JF, Voet T, et al. (2020). Identification of region-specific astrocyte subtypes at single cell resolution. Nat Commun 11, 1220. - PMC - PubMed
    1. Bertelsen EN, Larsen JT, Petersen L, Christensen J, and Dalsgaard S (2016). Childhood Epilepsy, Febrile Seizures, and Subsequent Risk of ADHD. Pediatrics 138. - PubMed
    1. Bipolar D, Schizophrenia Working Group of the Psychiatric Genomics Consortium. Electronic address, d.r.v.e., Bipolar, D., and Schizophrenia Working Group of the Psychiatric Genomics, C. (2018).
    1. Genomic Dissection of Bipolar Disorder and Schizophrenia, Including 28 Subphenotypes. Cell 173, 1705–1715 e1716. - PMC - PubMed

Publication types