. 2021 Jun 8;54(6):1137-1153.e8.
doi: 10.1016/j.immuni.2021.05.008. Epub 2021 May 28.

Dysbiosis exacerbates colitis by promoting ubiquitination and accumulation of the innate immune adaptor STING in myeloid cells

Affiliations

Dysbiosis exacerbates colitis by promoting ubiquitination and accumulation of the innate immune adaptor STING in myeloid cells

Liraz Shmuel-Galia et al. Immunity. .

Abstract

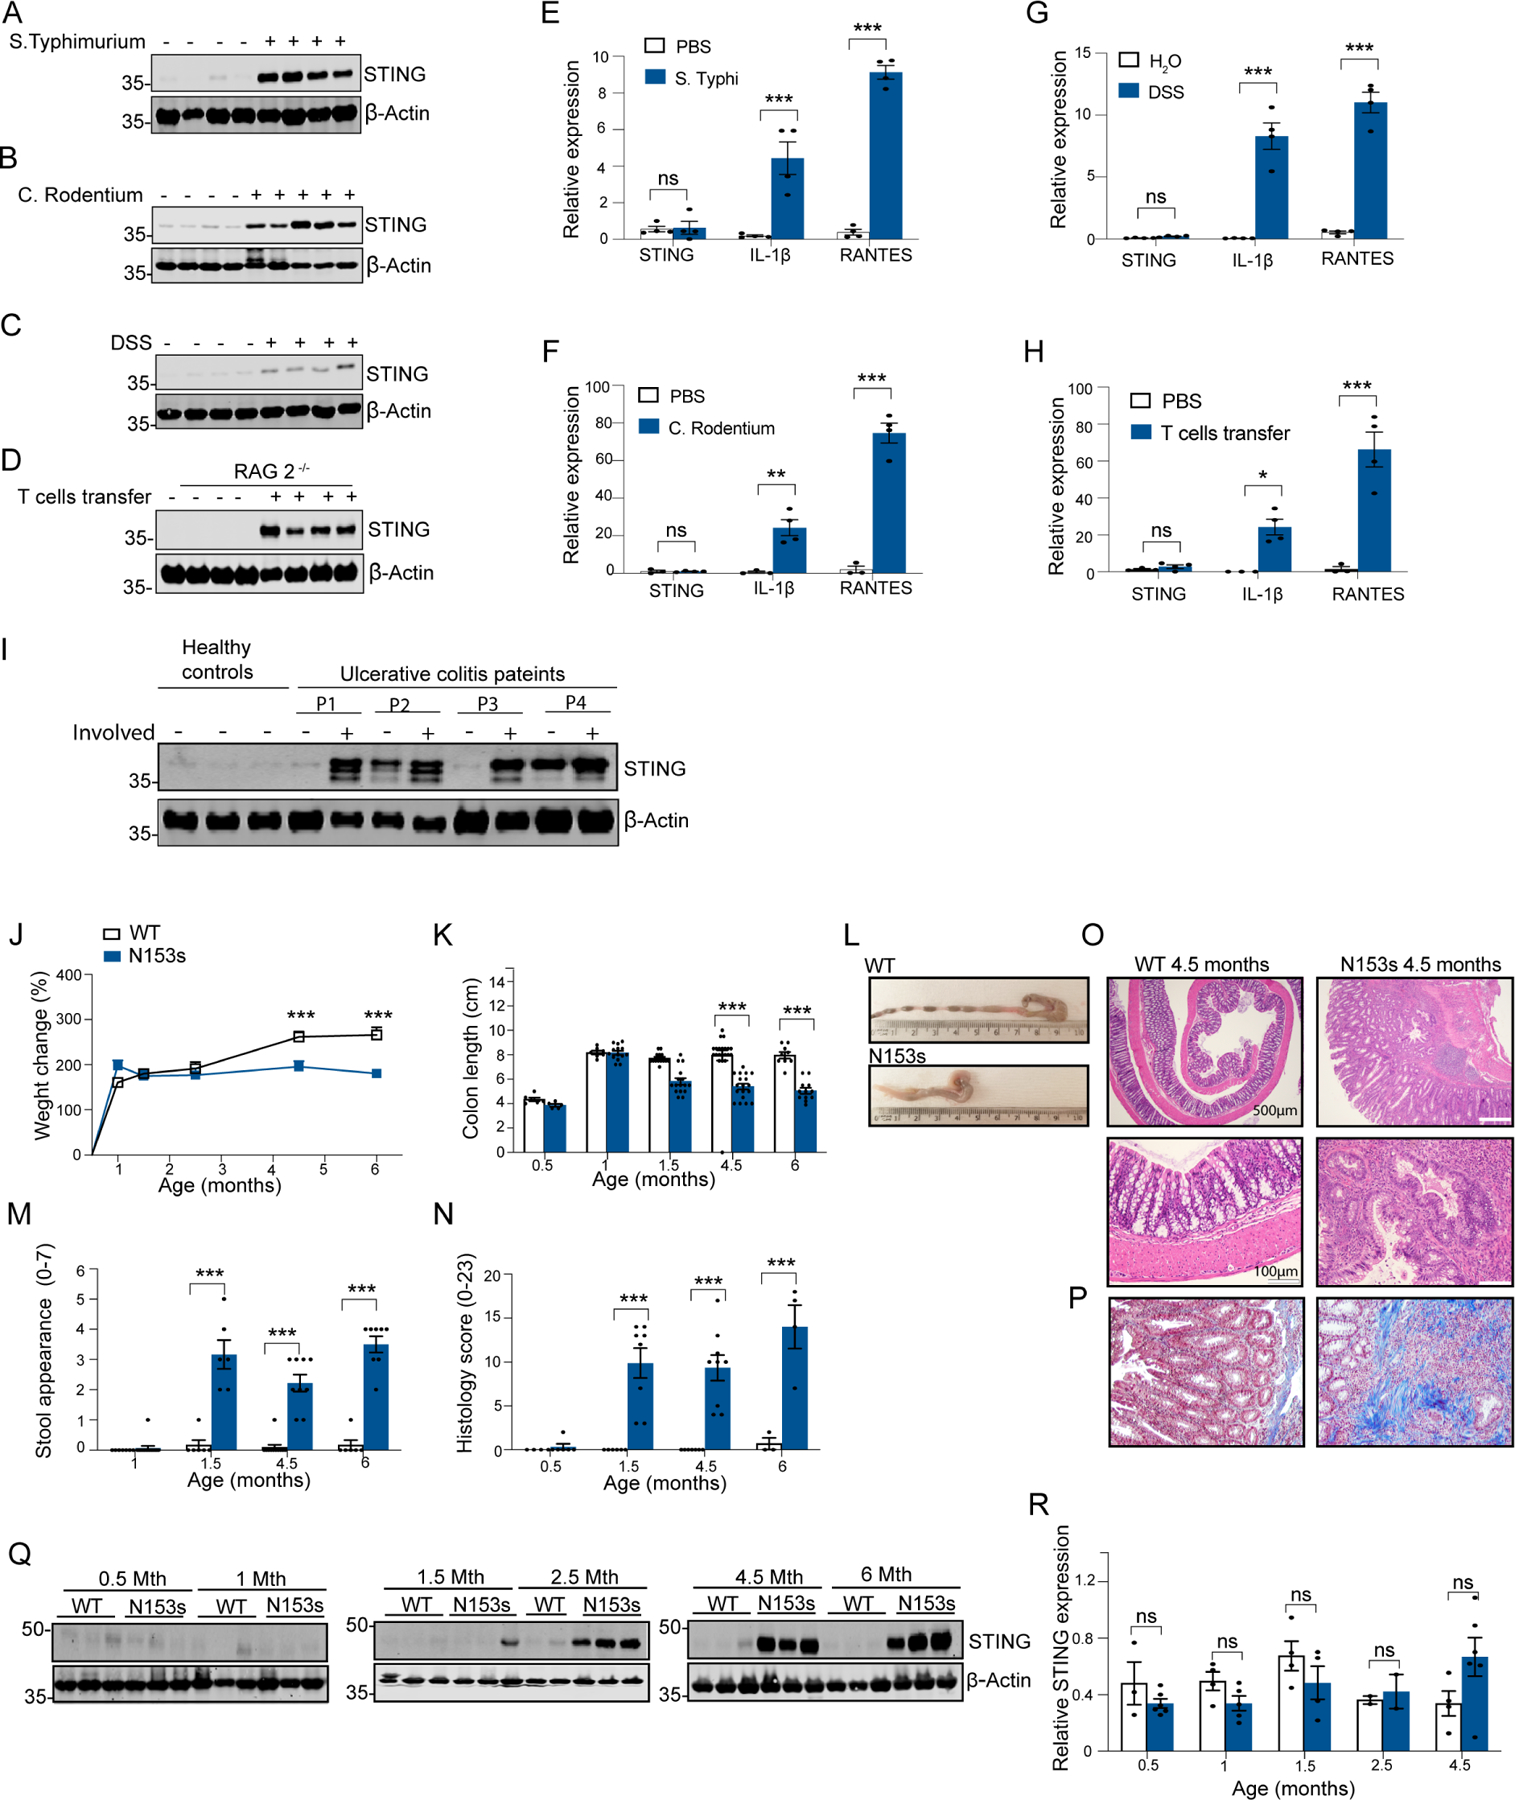
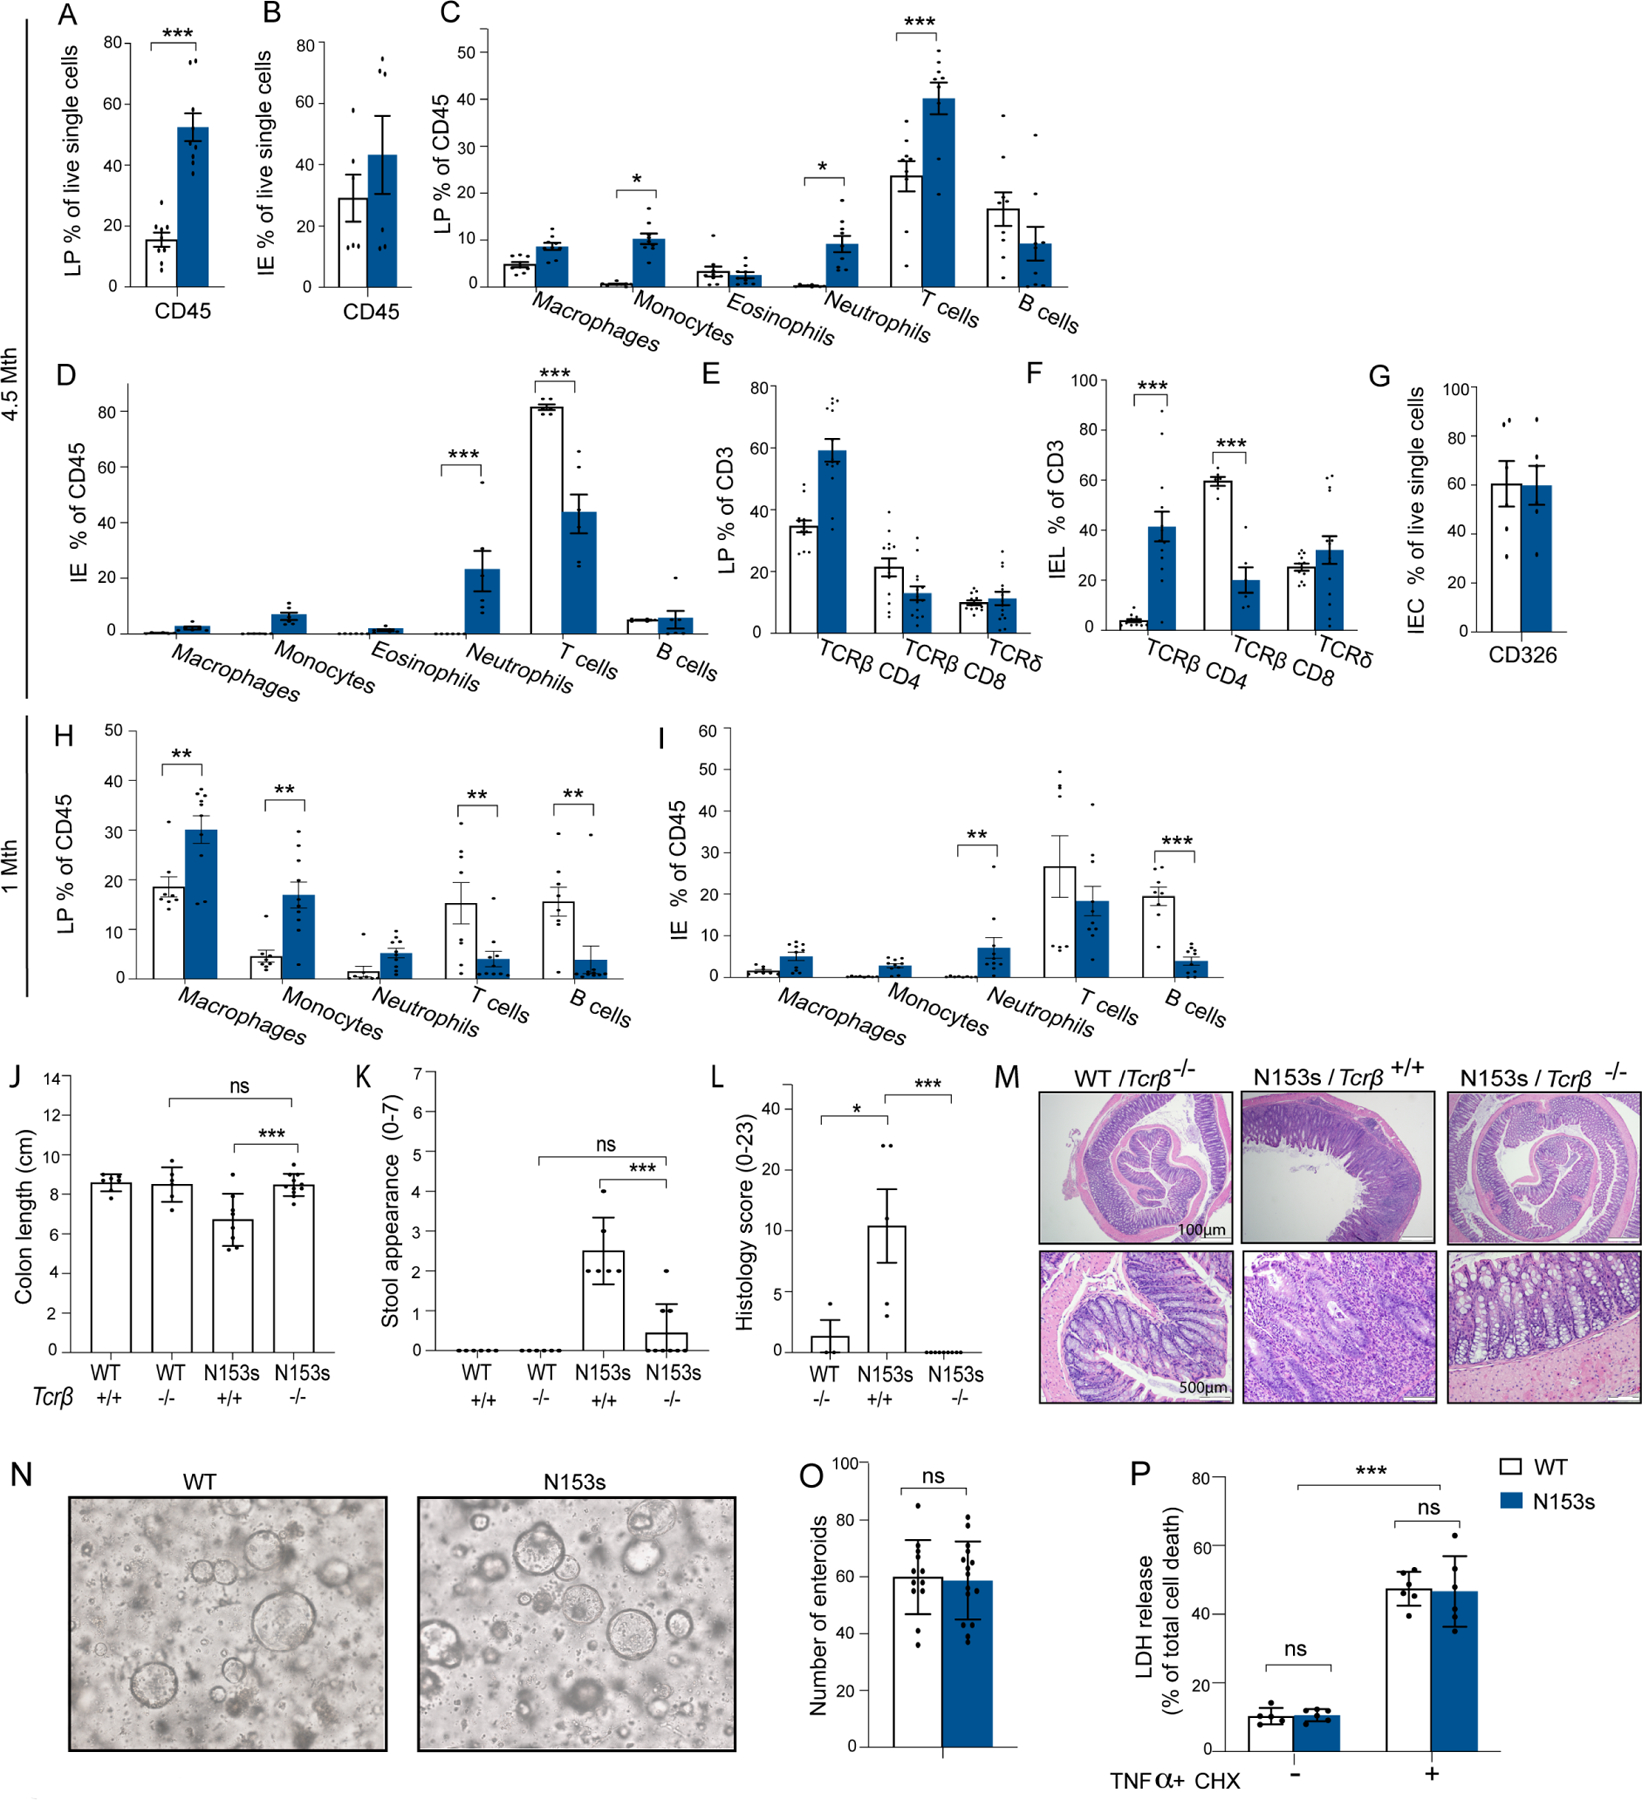
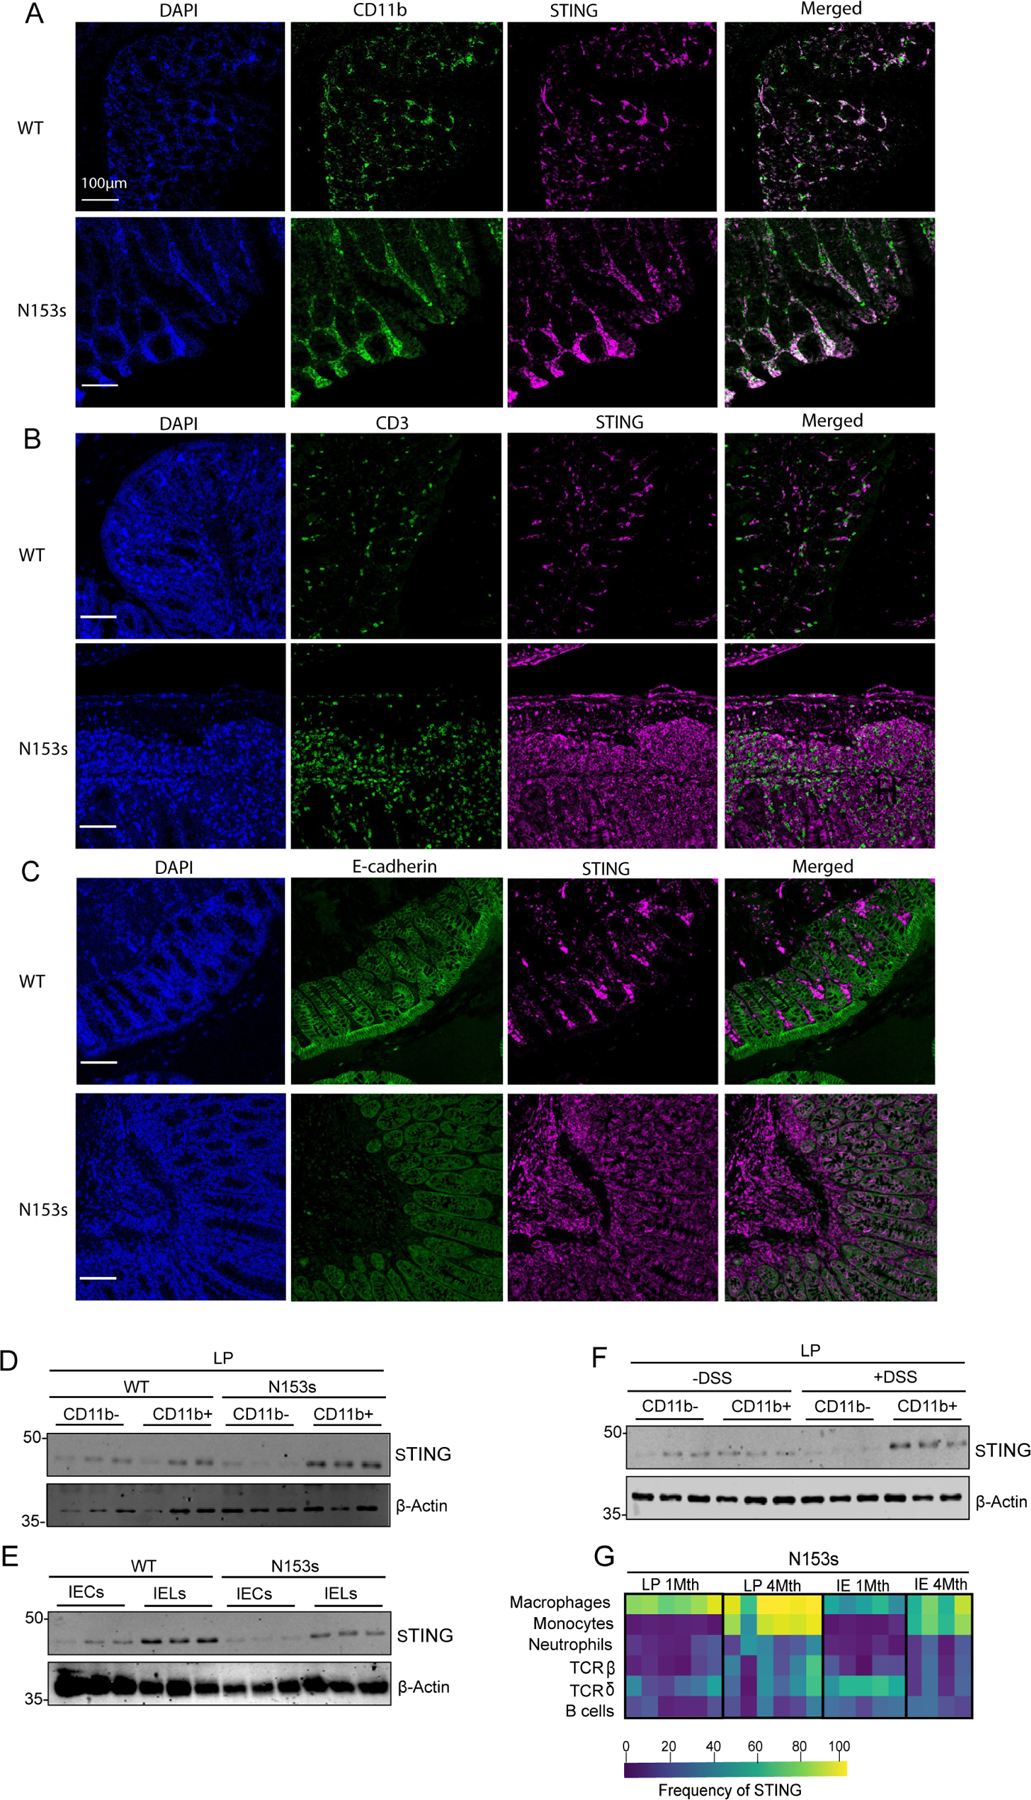
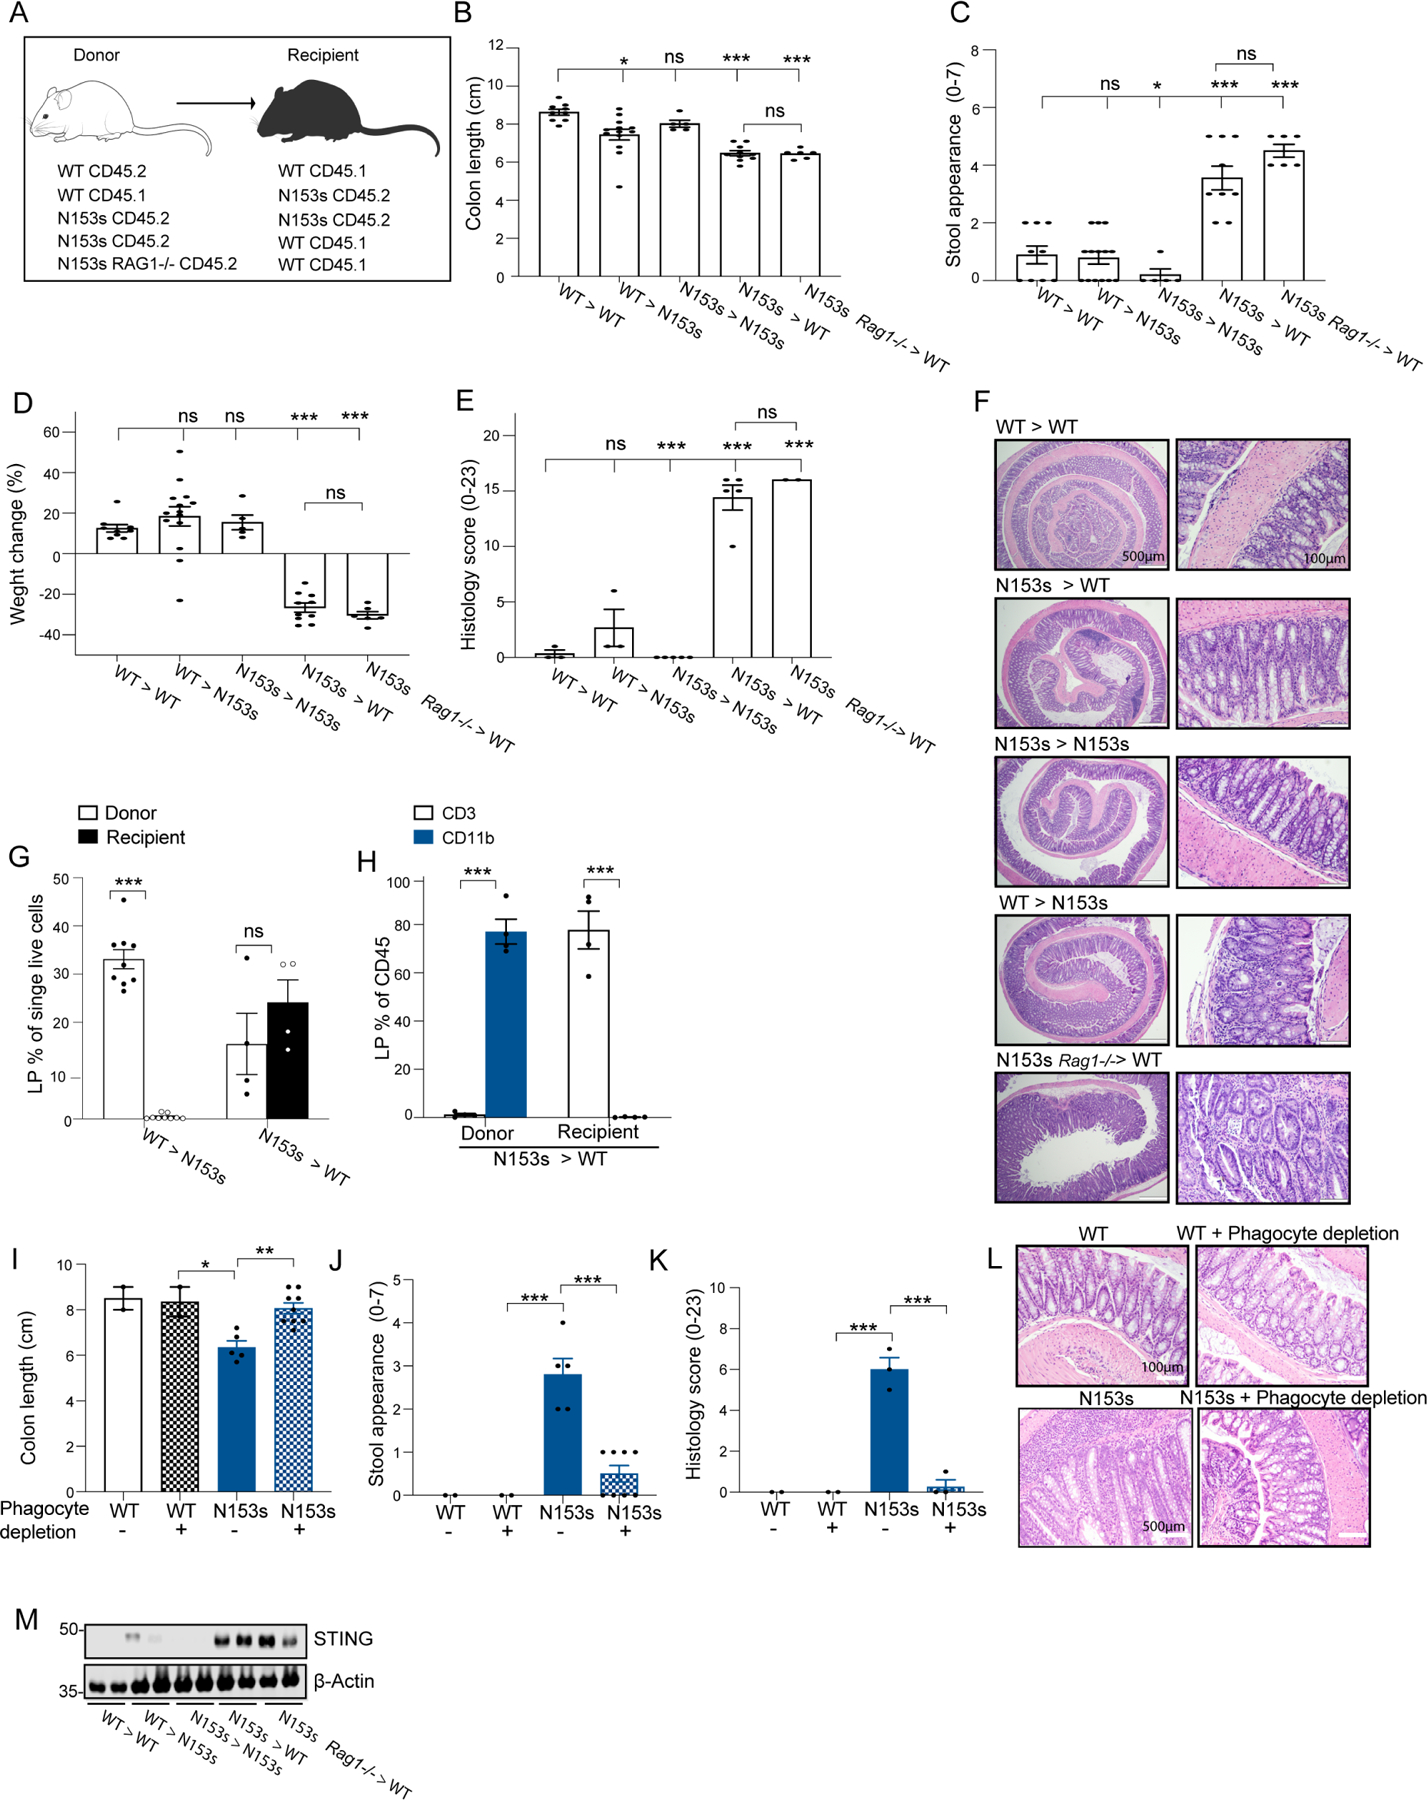
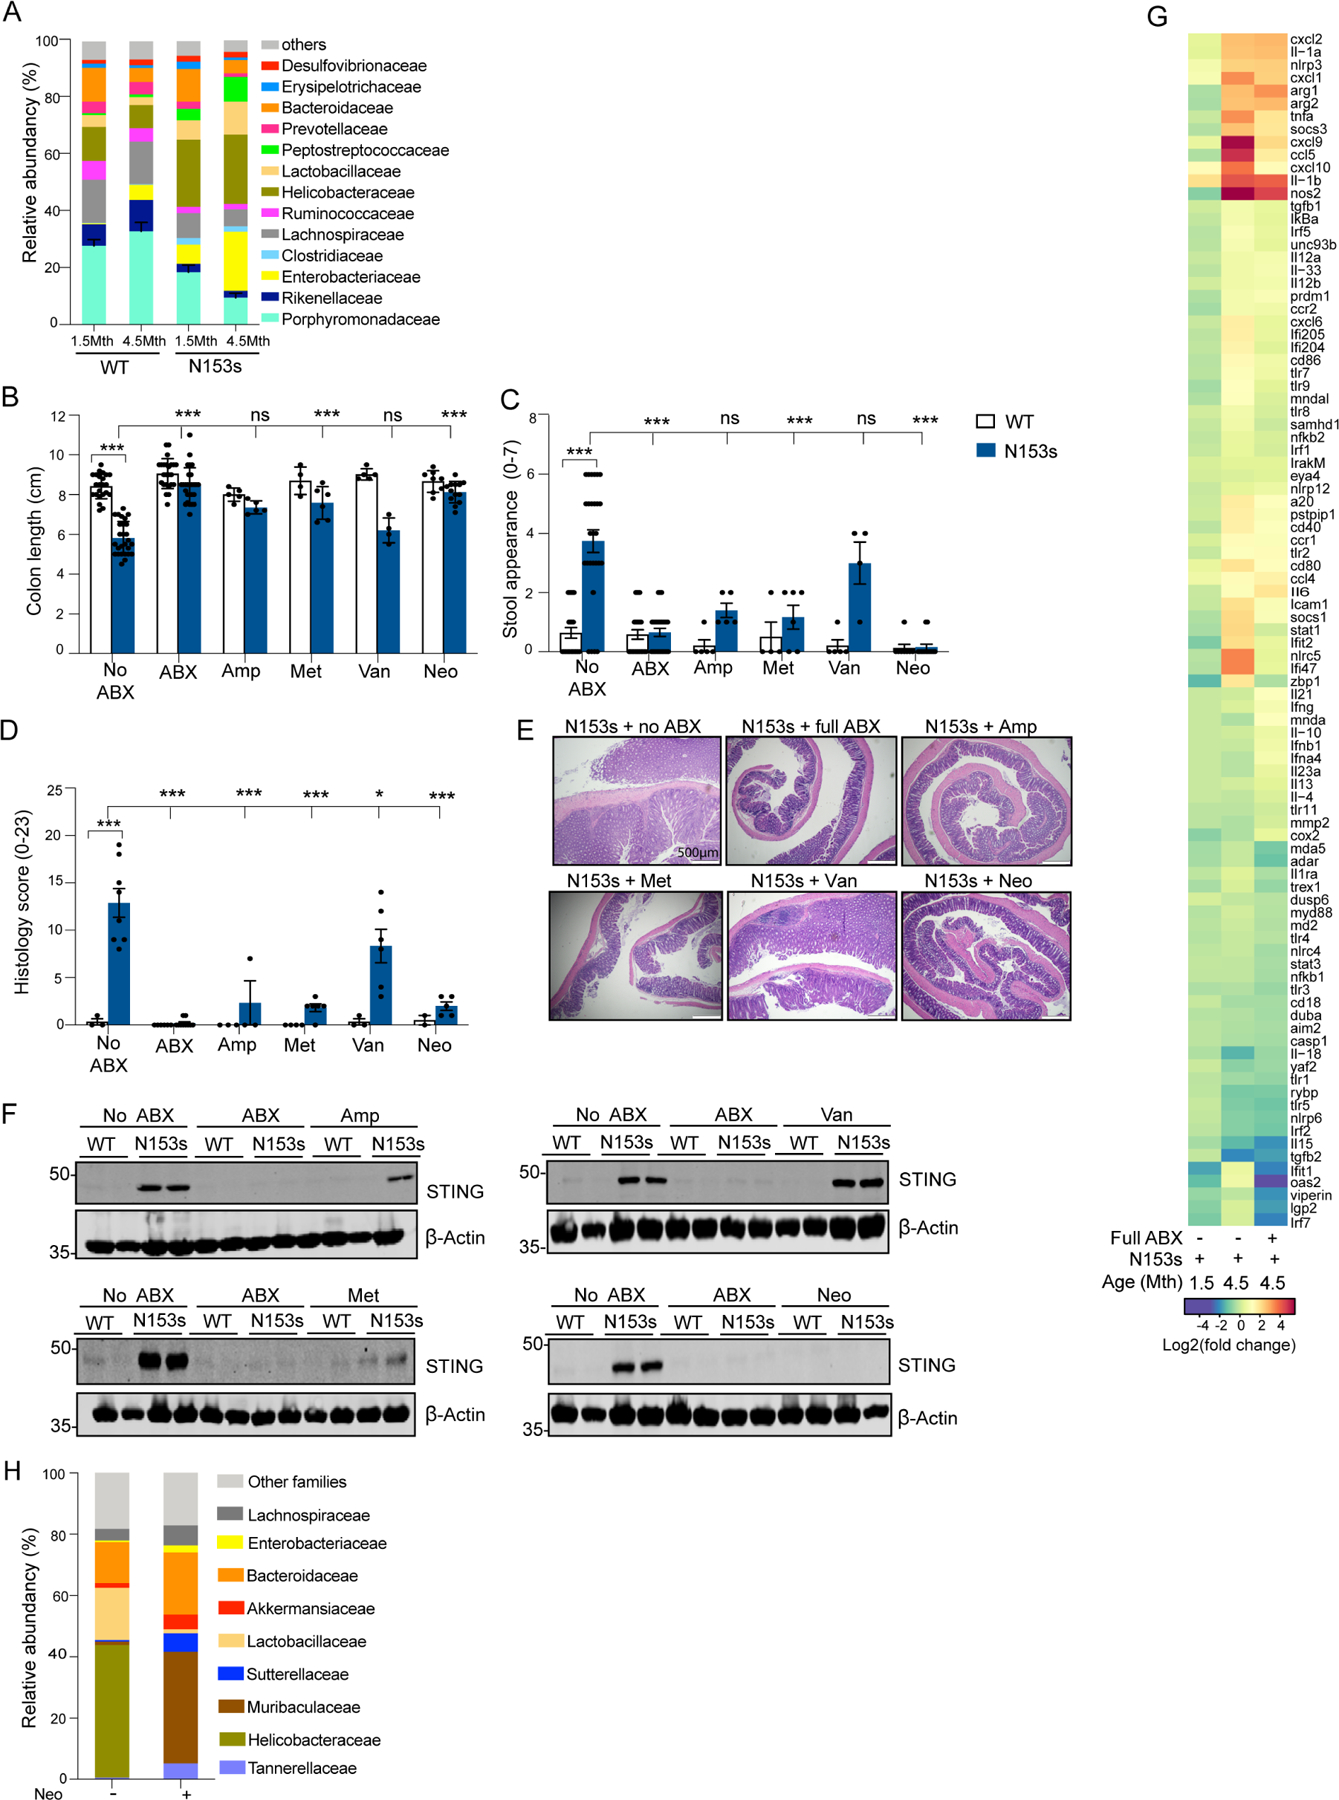
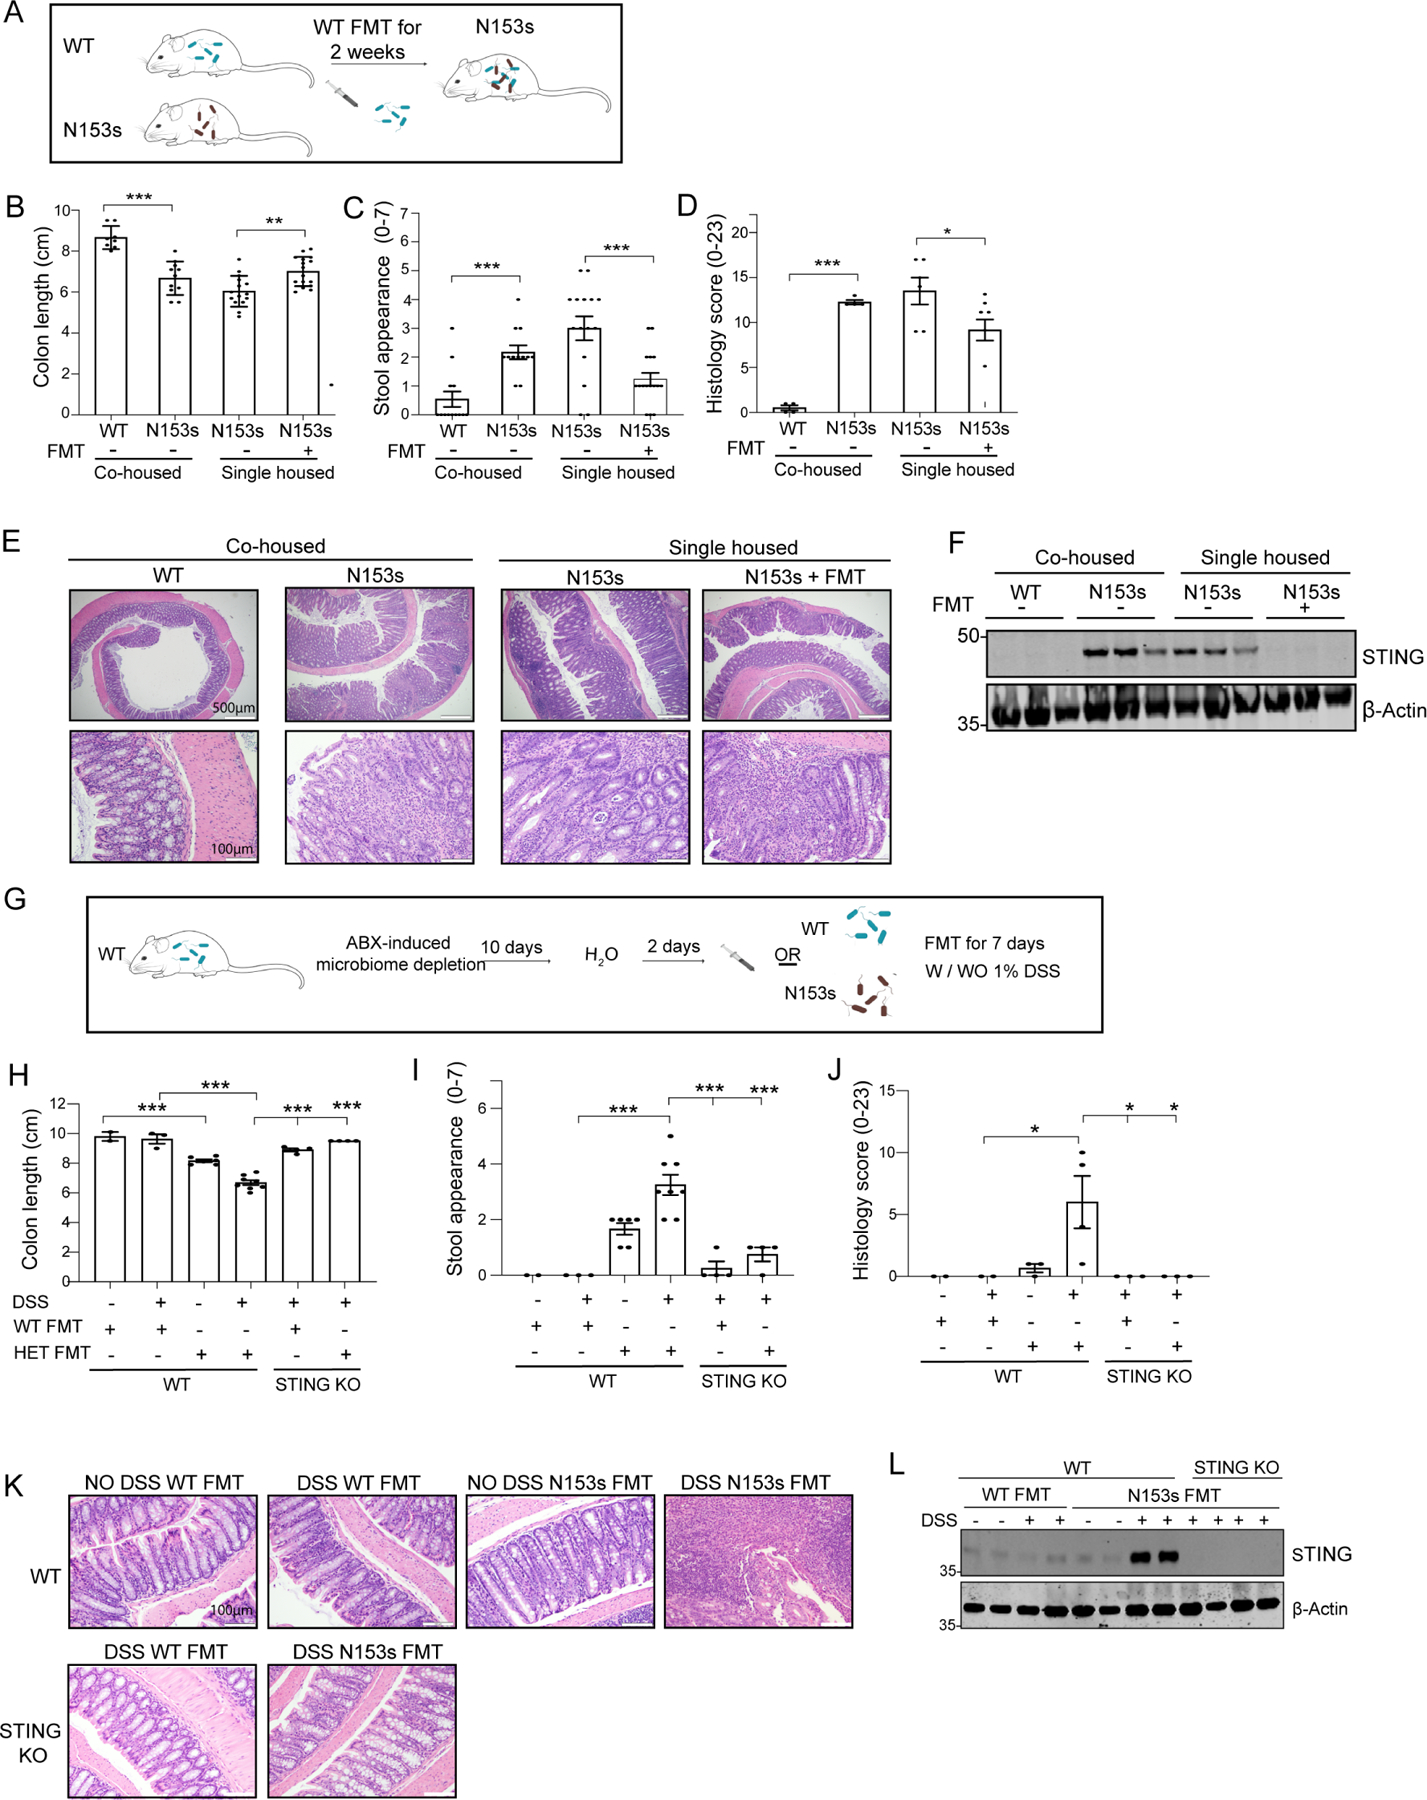
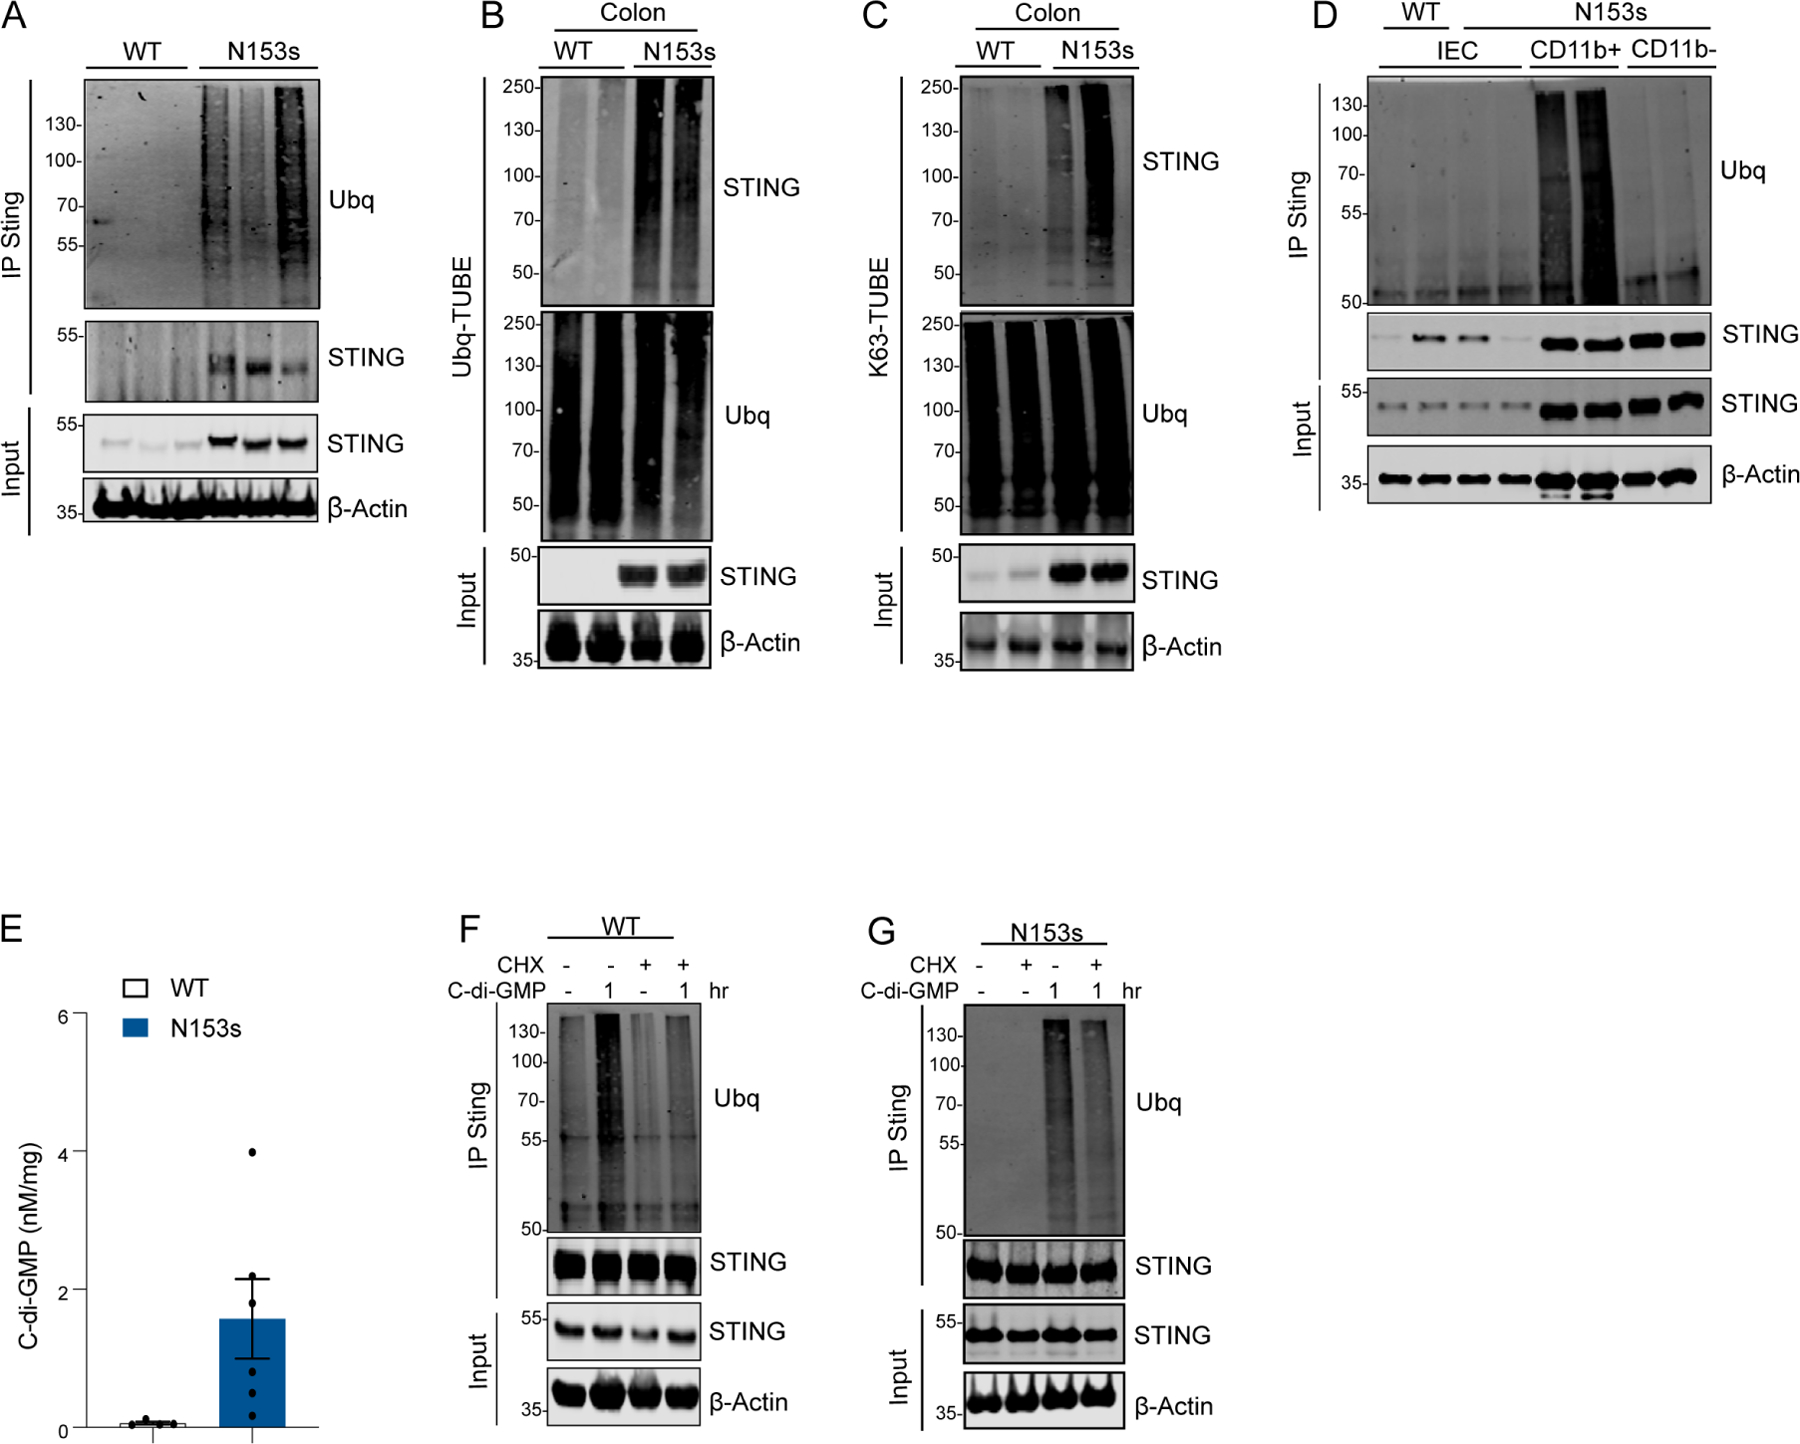
Alterations in the cGAS-STING DNA-sensing pathway affect intestinal homeostasis. We sought to delineate the functional role of STING in intestinal inflammation. Increased STING expression was a feature of intestinal inflammation in mice with colitis and in humans afflicted with inflammatory bowel disease. Mice bearing an allele rendering STING constitutively active exhibited spontaneous colitis and dysbiosis, as well as progressive chronic intestinal inflammation and fibrosis. Bone marrow chimera experiments revealed STING accumulation in intestinal macrophages and monocytes as the initial driver of inflammation. Depletion of Gram-negative bacteria prevented STING accumulation in these cells and alleviated intestinal inflammation. STING accumulation occurred at the protein rather than transcript level, suggesting post-translational stabilization. We found that STING was ubiquitinated in myeloid cells, and this K63-linked ubiquitination could be elicited by bacterial products, including cyclic di-GMP. Our findings suggest a positive feedback loop wherein dysbiosis foments the accumulation of STING in intestinal myeloid cells, driving intestinal inflammation.

Keywords: SAVI; STING; colitis; colon; commensal; dysbiosis; intestinal inflammation; microbiome; myeloid cells; ubiquitination.


Conflict of interest statement

Declaration of interests The authors have no competing interests to declare.

Figures

Figure 1.
Figure 1.. Intestinal inflammation licenses STING accumulation in the colon.
Representative images of Western blotting detecting STING (A-D) and qPCR analysis of colonic STING, IL-1β and RANTES mRNA (E-H) in mice challenged with (A, E) Salmonella typhimurium, (B, F) Citrobacter rodentium, (C, G) DSS and (D,H) adoptive CD45R+ T cells transfer (*P<0.05, **P<0.01, ***P<0.001, Data are represented as mean ±SEM of n=2–4 from 2 independent experiments). Representative image of Western blotting detecting STING in (I) healthy patients and affected and unaffected areas of colon from colitis patients. Data are represented as mean ±SEM of n=3–5). Western blot equal loading was detected by measuring β-actin and qPCR gene expression levels were normalized to TBP. Tmem173 heterozygous mice, N153s, develop spontaneous colitis and exhibit accumulation of STING and immune cells alterations in the colon. (J) Percentage weight change, (K-L) colon length, (M) stool appearance and (N) pathological score of H&E stained colon sections from N153s and WT littermate control mice at the indicated age. (***P<0.001, Data are represented as mean ±SEM of n=4–20). Representative (O) H&E and (P) Trichome stained colon sections of 4.5-month-old N153s and WT littermate control mice. (Q) Representative images of Western blotting detecting STING in N153s and WT littermate control mice at the indicated age. Equal loading was detected by measuring β-actin. (R) QPCR analysis of colonic STING mRNA in N153s and WT littermate control mice at the indicated age. Gene expression levels were normalized to TBP. (Data are represented as mean ±SEM of n=2–3 from 2 independent experiments).
Figure 2.
Figure 2.. N153s mice exhibit immune cell alterations in the colon.
Graphical summary of flow cytometry analysis of colonic LP (A) and IE (B) of N153s and WT mice at the age of 4.5-month-old mice. CD45+ cells presented as % out of live single cells. Graphical summary of LP (C) and IE (D) immune cell populations from 4.5-month-old N153s and WT littermate control mice presented as % out of CD45+ cells. Graphical summary of LP (E) and IE (F) TCRβ CD4, TCRβ CD8 and TCRδ T cells presented as % out of CD3+ cells. (G) CD326 positive IE cells presented as % out of live single cells. (Data are represented as mean ±SEM, for J-K n=3 from 3 independent experiments, for M-N, P n=3 from 2 independent experiments, for L, O n=1–4 from 5 independent experiments). LP (H) and IE (I) immune cell populations presented as % out of CD45+ cells from 1-month-old N153s and WT mice. (*P<0.05, **P<0.01, ***P<0.001. Data are represented as mean ±SEM of n=2–3 from 5 independent experiments). Intestinal inflammation in N153s mice is dependent on TCRβ T-cells not on intestinal epithelial cells. (J) colon length colitis score, (K) stool appearance, (L) pathology score and (M) representative H&E images of colon sections of the indicated mice at 2.5 to 4.5-months of age. (*P<0.05, ***P<0.001. Data are represented as mean ±SEM of n=2–6 from 5 independent experiments). (N) Representative images of mature enteroids and (O) enteroid numbers cultured from N153s and WT intestinal epithelial stem cells for 5 days (Data are represented as mean ±SEM of n=5–6 from 2 independent experiments). (P) Percentage LDH release of single layer intestinal epithelial cells (5×10^4) treated with or without TNFα (50ng/ml) and CHX (10μg/ml) for 24 hours (***P<0.001. Data are represented as mean ±SEM of n=3 of 2 independent experiments).
Figure 3.
Figure 3.. STING protein primarily expresses and accumulates in resident intestinal macrophages and proinflammatory monocytes during intestinal inflammation.
(A-C) Representative images of cellular localization of STING and (A) CD11b+ cells, (B) CD3 cells and (C) IECs (E-cadherin) in WT and N153s mice observed by confocal microscopy. Cells were probed with DAPI (left panels, blue), Opal 480-labeled CD11b+, Opal 480-labeled CD3 or FITC conjugated E-cadherin antibody as indicated (second left panels, green). Cells were co-stained with Opal 690-labeled STING (magenta, second right). Merged images of STING and the indicated cell populations are shown in the right panels. Scale bars, 100μm. Representative images of Western blotting detecting STING in indicated colonic cell populations isolated from (D-E) N153s and WT littermate control mice at 4.5 months of age and (F) WT mice challenged with 2% DSS for 7 days. Equal loading was detected by measuring β-actin. (G) Heat-map representing frequency of cells expressing STING in colonic LP and IE immune cells of each cell subset of N153s mice at the indicated age, quantified by flow cytometry (Data are represented as mean ±SEM of n=2–3 from 3–4 independent experiments).
Figure 4.
Figure 4.. Intrinsic activation of STING in myeloid cells drives intestinal inflammation.
(A-I) Bone marrow chimera experiments of the indicated irradiated (900R) mice reconstituted with 107 bone marrow cells from donor mice. WT CD45.2 > WT CD45.1, WT CD45.1 > N153s CD45.2, N153s CD45.2 > N153s CD45.2, N153s CD45.2 > WT CD45.1 and N153s RAG−/− CD45.2 > WT CD45.1 mice. (A) Schematic image illustrating chimera experiment design. Graphical summary of (B) colon length, (C) stool appearance, (D) weight change and (E) pathology score of the indicated mice 6 weeks post-reconstitution (*P<0.05, **P<0.01, ***P<0.001. Data are represented as mean ±SEM of n=2–9 from 2 independent experiments). (F) Representative images of H&E-stained colon sections from the indicated mice. (G) Flow cytometry analysis of LP donor and recipient cells presented as % out of single live cells of the indicated chimera mice. (H) Flow cytometry analysis of LP CD3+ and CD11b+ cells presenting as % out of donor and recipient cells of N153s > WT chimera mice. (***P<0.001. Data are represented as mean ±SEM of n=2–5 from 2 independent experiments). (I) Colon length, (J) stool appearance, (K) pathology score and (L) representative H&E images of colon sections of the indicated mice at 2-months of age. (*P<0.05, **P<0.01, ***P<0.001. Data are represented as mean ±SEM of n=2–4 from 2 independent experiments). (M) Immunoblot analysis of STING and β-actin in colon tissue lysates of the indicated mice.
Figure 5.
Figure 5.. Commensal dysbiosis drives colitis through accumulation of STING.
(A) Taxonomic profiling by 16S rDNA sequencing of the V3-V4 region showing relative abundances at the family levels of fecal commensals from N153s and WT cohoused littermate control mice at 1.5 and 4.5-months of age (Data are represented as mean ±SEM of n=22–24). Significance was measured by MaAsLin multivariate statistical framework. Data represent the mean relative abundance of bacterial families higher than 5% and sorted from highest significance on the bottom to lowest on the top. (B) colon length, (C) stool appearance and (D) pathology score of WT and N153s mice treated for 4-weeks with a full spectrum antibiotic (ABX) cocktail or the indicated single antibiotic, ampicillin (1gr/L), metronidazole (1gr/L), vancomycin (0.5gr/L) and neomycin (1gr/L). (***P<0.001. Data are represented as mean ±SEM of n=2–5 from 3–8 independent experiments). (E) Representative images of H&E stained colon sections from N153s mice following the indicated treatments. (F) Immunoblot analysis of STING and β-actin in colon tissue lysates isolated from WT and N153s mice following the indicated treatments. (G) Heat map of Nanostring analysis of inflammatory cytokines signatures in RNA extracted from colons of N153s and WT littermate control mice treated with full spectrum ABX cocktail calculated as fold reads in N153s over reads of the related WT mice. (Data are represented as mean of n=4). (H) Family-level relative abundance of fecal commensal flora by neomycin treatment of N153s mice as determined by WGS. Only taxa whose average relative abundance was greater than 5% are named, all other taxa are indicated as “Other families”. Significance as assessed using MaAsLin2 multivariate statistical framework. Neomycin treated mice received 1gr/L neomycin for 4 weeks.
Figure 6.
Figure 6.. Fecal Microbiota Transplantation (FMT) regulates STING protein levels in the colon altering intestinal inflammation.
(A-F) WT FMT alleviates intestinal inflammation and STING protein levels in N153s mice. (A) Schematic image illustrating FMT experimental design. WT FMT (aerobic and anaerobic) was administered via oral gavage to N153s mice every other day for 2 weeks. (B) colon length, (C) stool appearance and (D) pathology score of the indicated mice and treatments (*P<0.05, **P<0.01, ***P<0.001. Data are represented as mean ±SEM of n=3–13 from 2 independent experiments). (E) Representative images of H&E-stained colon sections from the indicated mice. (F) Immunoblot analysis of STING and β-actin in colon tissue lysates isolated from WT and N153s mice with the indicated treatments. (G-L) N153s FMT stabilizes STING protein in the colon and promote colitis in WT mice. (G) Schematic image illustrating FMT experimental design. WT mice were treated with full spectrum antibiotic cocktail for 10 days to deplete commensal bacteria, following 2 days of sterile water. WT or N153s FMT was administrated every other day (aerobic and anaerobic) for 7 days with/wo low concentration of DSS (1%). (H) colon length, (I) stool appearance and (J) pathology score of the indicated mice and treatments (*P<0.05,***P<0.001. Data are represented as mean ±SEM of n=2–5 from 2 independent experiments). (K) Representative images of H&E-stained colon sections from the indicated mice. (L) Immunoblot analysis of STING and β-actin in colon tissue lysates isolated from WT and N153s mice with the indicated treatments.
Figure 7.
Figure 7.. Dysbiosis-mediated STING ubiquitination stabilizes STING in the colon.
Representative images of western blotting detecting STING ubiquitination. (A) Immunoblot analysis of Ubiquitin (Ubq) and STING in lysate and immunoprecipitated (IP) samples from N153s mice. (B) STING and Ubq in TUBE-Ubq elution and cell lysates from colon tissue of the indicated mice at the age of 4.5-month-old. (C) STING and K63-Ubq in K63-TUBE-FLAG elution and cell lysates from colon tissue of the indicated mice (pooled from 4–6 mice) at the age of 4.5-month-old. Immunoblot analysis of Ubiquitin (Ubq) and STING in lysate and immunoprecipitated (IP) samples from (D) isolated colonic IECs, CD11b+ myeloid cells and CD11b- lymphocytes from N153s (for all cell types) and WT littermate control mice (only for IECs). (E) Mass spectrometry measurements of colonic C-di-GMP concentration (*P<0.05. Data are represented as mean ±SEM of 6 N153s and 4 WT littermate control mice). Immunoblot analysis of Ubiquitin (Ubq) and STING in lysate and immunoprecipitated (IP) samples from (F) WT and (G) N153s BMDM with the indicated treatments. Equal loading was detected by measuring β-actin.

Similar articles

Cited by

References

    1. ABE T & BARBER GN 2014. Cytosolic-DNA-mediated, STING-dependent proinflammatory gene induction necessitates canonical NF-kappaB activation through TBK1. J Virol, 88, 5328–41. - PMC - PubMed
    1. ADEN K, TRAN F, ITO G, SHEIBANI-TEZERJI R, LIPINSKI S, KUIPER JW, TSCHURTSCHENTHALER M, SAVELJEVA S, BHATTACHARYYA J, HASLER R, BARTSCH K, LUZIUS A, JENTZSCH M, FALK-PAULSEN M, STENGEL ST, WELZ L, SCHWARZER R, RABE B, BARCHET W, KRAUTWALD S, HARTMANN G, PASPARAKIS M, BLUMBERG RS, SCHREIBER S, KASER A & ROSENSTIEL P 2018. ATG16L1 orchestrates interleukin-22 signaling in the intestinal epithelium via cGAS-STING. J Exp Med, 215, 2868–2886. - PMC - PubMed
    1. AHN J, SON S, OLIVEIRA SC & BARBER GN 2017. STING-Dependent Signaling Underlies IL-10 Controlled Inflammatory Colitis. Cell Rep, 21, 3873–3884. - PMC - PubMed
    1. ALAM MT, AMOS GCA, MURPHY ARJ, MURCH S, WELLINGTON EMH & ARASARADNAM RP 2020. Microbial imbalance in inflammatory bowel disease patients at different taxonomic levels. Gut Pathog, 12, 1. - PMC - PubMed
    1. BENNION BG, INGLE H, AI TL, MINER CA, PLATT DJ, SMITH AM, BALDRIDGE MT & MINER JJ 2019. A Human Gain-of-Function STING Mutation Causes Immunodeficiency and Gammaherpesvirus-Induced Pulmonary Fibrosis in Mice. J Virol, 93. - PMC - PubMed

Publication types