Comparative Study
. 2021 Jul 13;54(7):1578-1593.e5.
doi: 10.1016/j.immuni.2021.05.002. Epub 2021 May 9.

Distinct immunological signatures discriminate severe COVID-19 from non-SARS-CoV-2-driven critical pneumonia

Affiliations
Comparative Study

Distinct immunological signatures discriminate severe COVID-19 from non-SARS-CoV-2-driven critical pneumonia

Stefanie Kreutmair et al. Immunity. .

Erratum in

  • Distinct immunological signatures discriminate severe COVID-19 from non-SARS-CoV-2-driven critical pneumonia.
    Kreutmair S, Unger S, Núñez NG, Ingelfinger F, Alberti C, De Feo D, Krishnarajah S, Kauffmann M, Friebel E, Babaei S, Gaborit B, Lutz M, Jurado NP, Malek NP, Goepel S, Rosenberger P, Häberle HA, Ayoub I, Al-Hajj S, Nilsson J, Claassen M, Liblau R, Martin-Blondel G, Bitzer M, Roquilly A, Becher B. Kreutmair S, et al. Immunity. 2022 Feb 8;55(2):366-375. doi: 10.1016/j.immuni.2022.01.015. Immunity. 2022. PMID: 35139354 Free PMC article. No abstract available.

Abstract

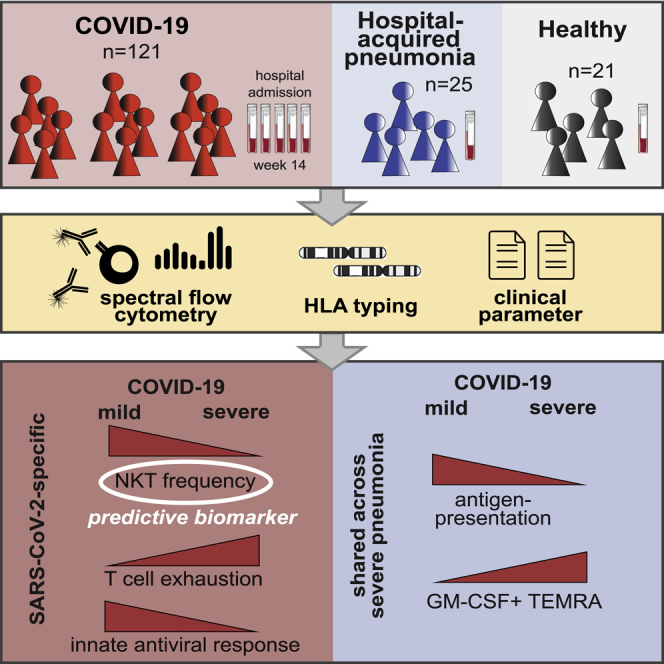
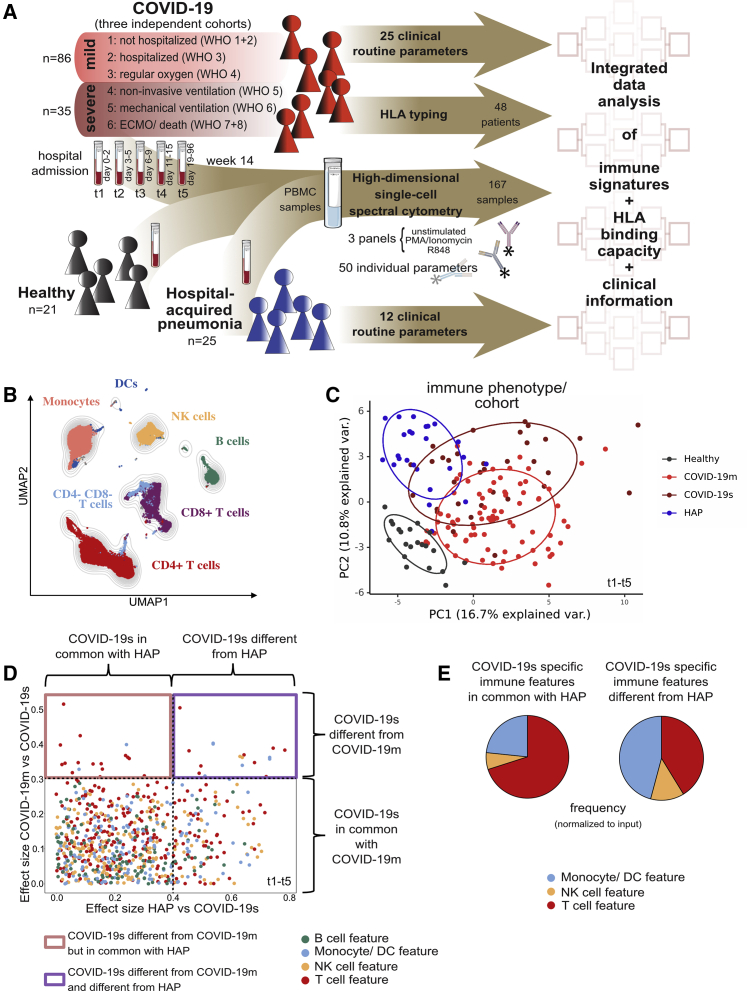
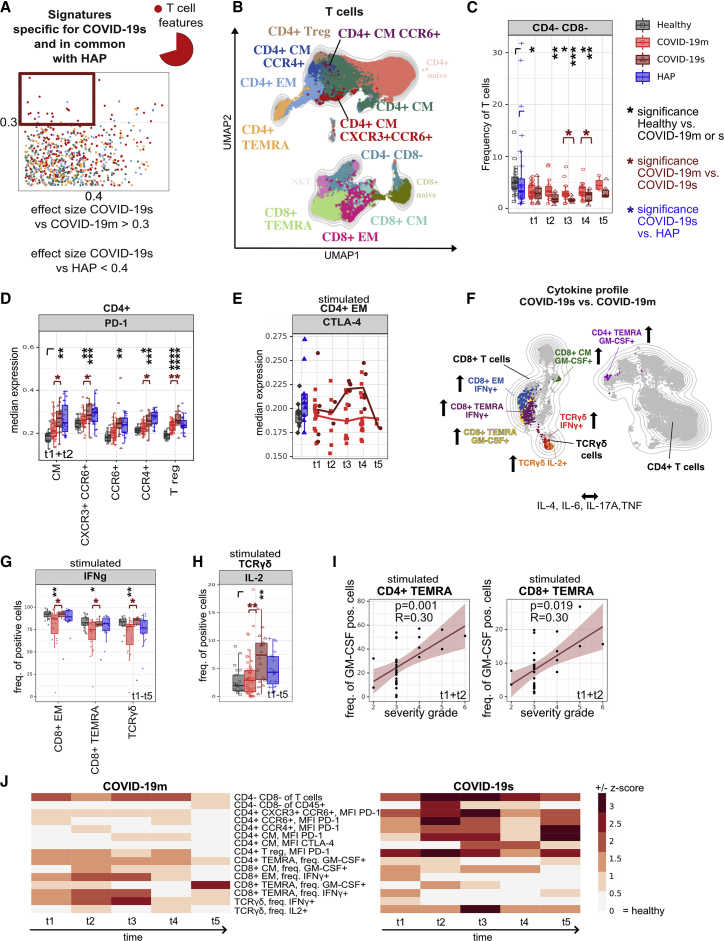
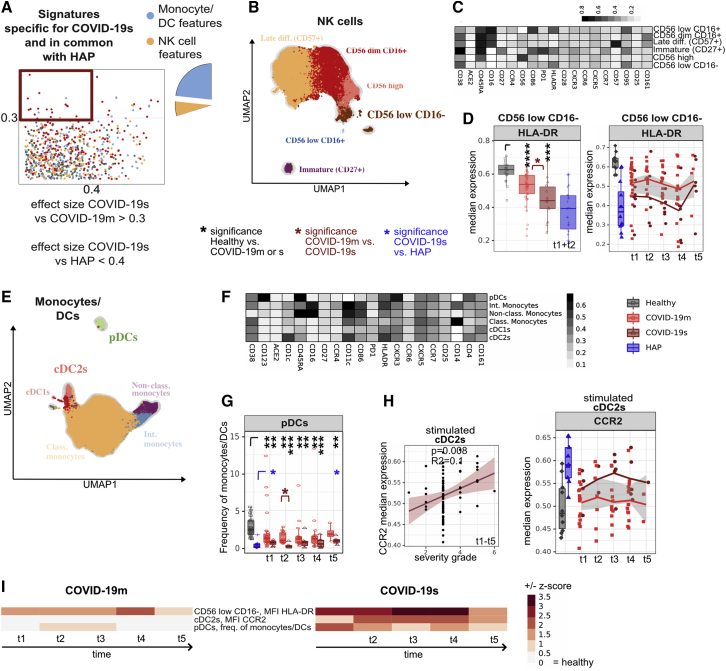
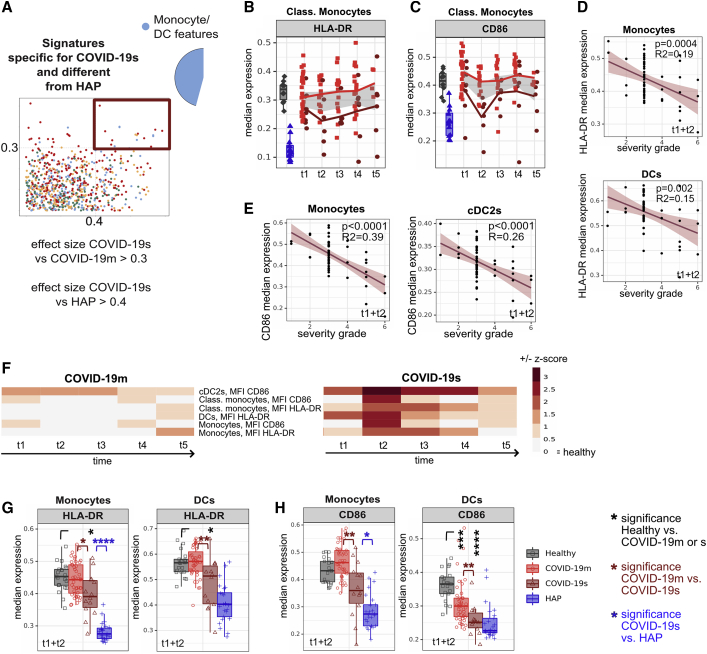
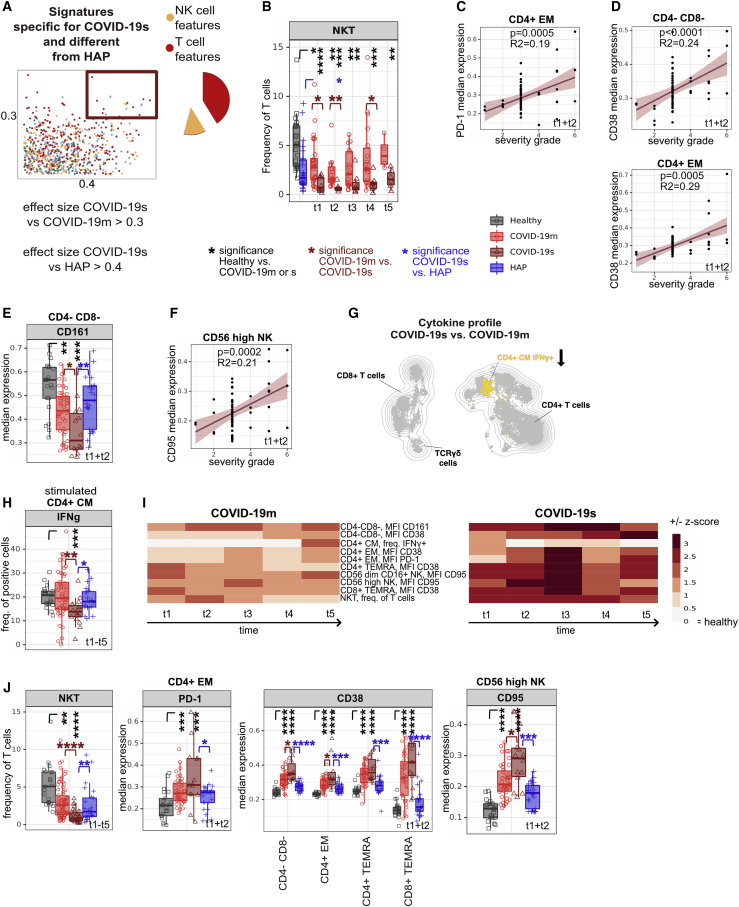
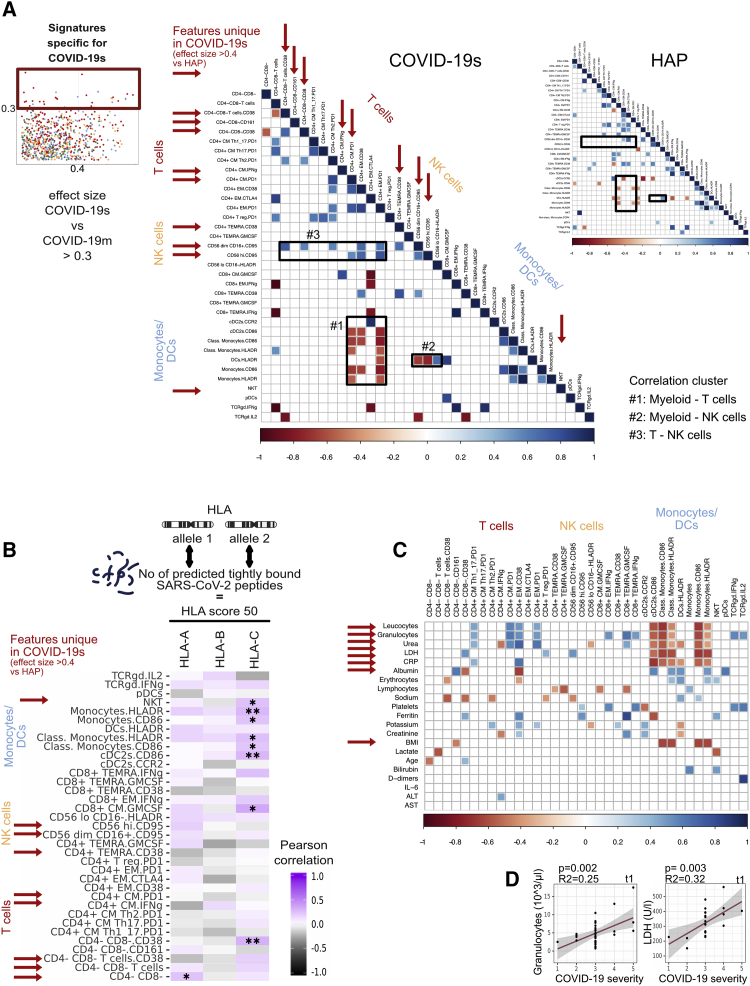
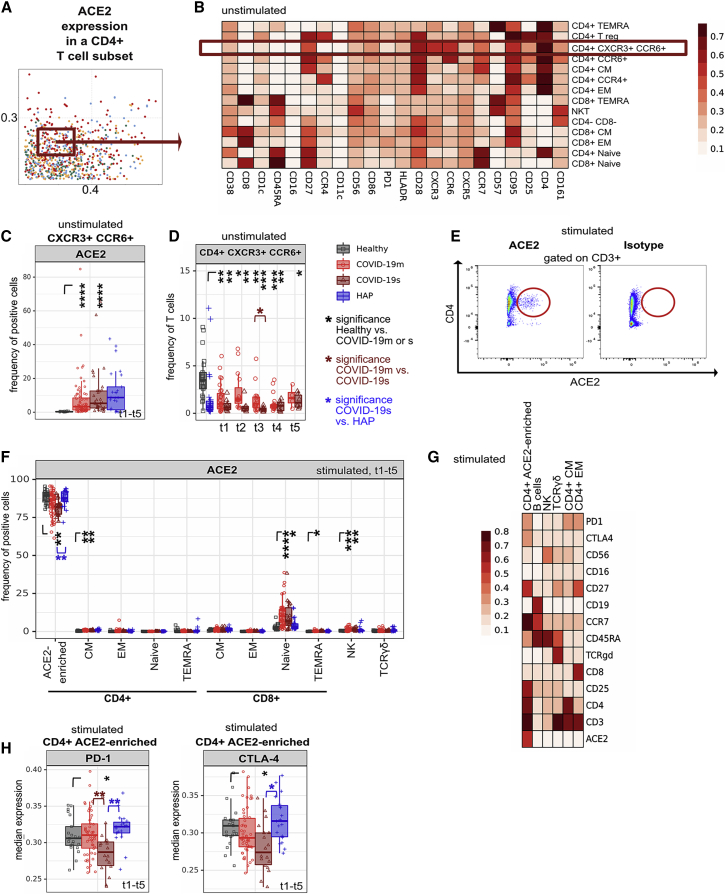
Immune profiling of COVID-19 patients has identified numerous alterations in both innate and adaptive immunity. However, whether those changes are specific to SARS-CoV-2 or driven by a general inflammatory response shared across severely ill pneumonia patients remains unknown. Here, we compared the immune profile of severe COVID-19 with non-SARS-CoV-2 pneumonia ICU patients using longitudinal, high-dimensional single-cell spectral cytometry and algorithm-guided analysis. COVID-19 and non-SARS-CoV-2 pneumonia both showed increased emergency myelopoiesis and displayed features of adaptive immune paralysis. However, pathological immune signatures suggestive of T cell exhaustion were exclusive to COVID-19. The integration of single-cell profiling with a predicted binding capacity of SARS-CoV-2 peptides to the patients' HLA profile further linked the COVID-19 immunopathology to impaired virus recognition. Toward clinical translation, circulating NKT cell frequency was identified as a predictive biomarker for patient outcome. Our comparative immune map serves to delineate treatment strategies to interfere with the immunopathologic cascade exclusive to severe COVID-19.

Trial registration: ClinicalTrials.gov NCT04385108.

Keywords: COVID-19; GM-CSF; HLA typing; SARS-CoV-2; biomarker; high-dimensional single cell analysis; immune profiling; immunophenotyping; peptide binding strength; spectral flow cytometry.


Conflict of interest statement

Declaration of interests The authors declare no competing interests.

Figures

None
Graphical abstract
Figure 1
Figure 1
Immunomonitoring reveals differing immune landscapes in COVID-19m, COVID-19s, and HAP patients (A) Schematic of experimental approach. (B) UMAP with FlowSOM overlay showing total CD45pos cells of combined samples. One thousand cells were subsetted from every sample from each cohort. (C) PCA of the total immune compartment on the basis of marker expression in the surface panel. (D) Comparison of immune features derived from each leukocyte subpopulation between experimental groups. A dot plot displaying the ES calculated in HAP versus COVID-19s (x axis; threshold 0.4) compared with the ES calculated in COVID-19m versus COVID-19s (y axis; threshold 0.3). Each dot represents one immunological feature; colors represent the leukocyte compartment they refer to. (E) Proportion of each immune compartment (normalized to input) in the identified sets of immune features highlighted in (D). See also Figure S1.
Figure 2
Figure 2
Shared T cell features between severe pathogen-induced RSs highlight the emergence of hyperinflammatory and exhausted subsets in COVID-19s (A) Comparison of immune features derived from each leukocyte subpopulation between experimental groups. A dot plot displaying the ES calculated in HAP versus COVID-19s (x axis; threshold 0.4) compared with the ES calculated in COVID-19m versus COVID-19s (y axis; threshold 0.3). Each dot represents one immunological feature. The red box highlights immune features, which are associated with severe RS (COVID-19s and HAP), with a focus on changes within the T cell fraction. (B) UMAP with FlowSOM overlay of total T cells of combined samples. One thousand cells were subsetted from every sample from each cohort. T cell subsets with transparent names do not contain immune features highlighted in (A). (C) Median frequencies and 25th and 75th percentiles of FlowSOM-generated CD4 CD8 (TCRγδ-enriched) immune cell cluster. (D) Median expression and 25th and 75th percentiles of PD-1 in FlowSOM-generated immune cell clusters shown in (B). (E) Median expression of CTLA-4 within CD4+ EM T cell subset of HCs shown in gray, of HAP in blue, and of mild and severe COVID-19 patients across TPs 1–5 shown in red. (F) Schematic overview of cytokine polarization profile comparing COVID-19s and COVID-19m. UMAP with FlowSOM overlay shows cytokine-producing T cell subpopulations (features reaching ES > 0.3). One thousand T cells were subsetted from every sample from each cohort. (G) Median frequency and 25th and 75th percentiles of IFN-γ-positive cells in FlowSOM-generated immune cell clusters shown in F. (H) Median frequency and 25th and 75th percentiles of IL-2-positive cells in FlowSOM-generated immune cell cluster shown in (F). (I) Correlation between frequency of GM-CSF expressing CD4+ (left panel) and CD8+ (right panel) TEMRA cells and the severity grade of COVID-19 patients in combined TPs 1 and 2. (J) Heatmap depicting the Z score of each T cell related immune feature (highlighted in A) compared with HCs for every TP. Both negative and positive changes are visualized by intensity of red color scale. MFI, mean fluorescence intensity. p < 0.05, ∗∗p < 0.01, ∗∗∗p < 0.001, and ∗∗∗∗p < 0.0001, Mann-Whitney test, Benjamini-Hochberg (BH) correction. See also Figure S2.
Figure 3
Figure 3
Phenotypic alterations in innate immune signatures are shared in severe COVID-19 and HAP (A) Comparison of immune features derived from each leukocyte subpopulation between experimental groups. A dot plot displaying the ES calculated in HAP versus COVID-19s (x axis; threshold 0.4) compared with the ES calculated in COVID-19m versus COVID-19s (y axis; threshold 0.3). Each dot represents one immunological feature. The red box highlights immune features, which are associated with severe RS, with a focus on changes within the monocyte, DC, and NK cell fraction. (B) UMAP with FlowSOM overlay of total NK cells of combined samples. One thousand cells were subsetted from every sample from each cohort. NK cell subsets with transparent names do not contain immune features highlighted in (A). (C) Median expression of various markers in FlowSOM-derived clusters shown in (B). (D) Median expression and 25th and 75th percentiles of HLA-DR in FlowSOM-generated CD56low CD16 NK cell cluster shown in (B), combined for TP 1 and 2 (left panel) or displayed for every individual TP (right panel). (E) UMAP with FlowSOM overlay of total monocytes and DCs of combined samples. One thousand cells were subsetted from every sample from each cohort. Monocyte and DC subsets with transparent names do not contain immune features highlighted in (A). (F) Median expression of various markers in FlowSOM-derived clusters shown in (E). (G) Median frequencies and 25th and 75th percentiles of FlowSOM-generated pDC immune cell cluster. (H) Correlation between median expression of CCR2 in cDC2s following TLR7 and TLR8 stimulation against the severity grade of COVID-19 patients. All TPs have been pooled in the left panel and individual TPs depicted in the right panel. (I) Heatmap depicting the Z score of each monocyte and DC related immune feature (highlighted in A) compared with HCs for every TP. Both negative and positive changes are visualized by intensity of red color scale. MFI, mean fluorescence intensity. p < 0.05, ∗∗p < 0.01, ∗∗∗p < 0.001, and ∗∗∗∗p < 0.0001, Mann-Whitney test, BH correction. See also Figure S3.
Figure 4
Figure 4
Impaired antigen presentation distinguishes the immune response to SARS-CoV-2 versus other respiratory pathogens (A) Comparison of immune features derived from each leukocyte subpopulation between experimental groups. A dot plot displaying the ES calculated in HAP versus COVID-19s (x axis; threshold 0.4) compared with the ES calculated in COVID-19m versus COVID-19s (y axis; threshold 0.3). Each dot represents one immunological feature. The red box highlights immune features, which are different in COVID-19s and HAP, with a focus on changes within the monocyte and DC fraction. (B and C) Median expression of HLA-DR (B) or CD86 (C) within classical monocytes of HCs shown in gray, HAP patients in blue, and COVID-19m and COVID-19s patients across TPs 1–5 shown in red. (D and E) Correlation between median expression of HLA-DR (D) or CD86 (E) in monocytes or DCs (TPs 1 and 2 pooled) against the severity grade of COVID-19 patients. (F) Heatmap depicting the Z score of each monocyte and DC related immune feature (highlighted in A) compared with HCs for every TP. Both negative and positive changes are visualized by intensity of red color scale. (G and H) Median expression and the 25th and 75th percentiles of HLA-DR (G) or CD86 (H) in FlowSOM-generated monocyte and DC immune cell clusters. p < 0.05, ∗∗p < 0.01, ∗∗∗p < 0.001, and ∗∗∗∗p < 0.0001, Mann-Whitney test, BH correction. See also Figure S4.
Figure 5
Figure 5
Distinct signatures of COVID-19s are exclusive to the lymphocyte compartment (A) Comparison of immune features derived from each leukocyte subpopulation between experimental groups. A dot plot displaying the ES calculated in HAP versus COVID-19s (x axis; threshold 0.4) compared with the ES calculated in COVID-19m versus COVID-19s (y axis; threshold 0.3). Each dot represents one immunological feature. The red box highlights immune features, which are different in COVID-19s and HAP, with a focus on changes within the T and NK cell fraction. (B) Median frequencies and 25th and 75th percentiles of FlowSOM-generated NKT immune cell cluster. (C) Correlation between median expression of PD-1 in CD4+ EM cells (TPs 1 and 2 pooled) against the severity grade of COVID-19 patients. (D) Correlation between median expression of CD38 in CD4 CD8 (TCRγδ-enriched) and CD4+ EM T cells (TPs 1 and 2 pooled) against the severity grade of COVID-19 patients. (E) Median expression and 25th and 75th percentiles of CD161 in FlowSOM-generated CD4 CD8 (TCRγδ-enriched) immune cell cluster. (F) Correlation between median expression of CD95 in CD56high NK cells (TPs 1 and 2 pooled) against the severity grade of COVID-19 patients. (G) Schematic overview of cytokine polarization profile comparing COVID-19s and COVID-19m. UMAP with FlowSOM overlay shows cytokine-producing T cells (features reaching an ES > 0.3 versus COVID-19m and > 0.4 versus HAP). One thousand T cells were subsetted from every sample from each cohort. (H) Median frequency and 25th and 75th percentiles of IFN-γ-positive cells in FlowSOM-generated immune cell clusters shown in (G). (I) Heatmap depicting the Z score of each T and NK cell related immune feature (highlighted in A) compared with HCs for every TP. Both negative and positive changes are visualized by intensity of red color scale. MFI, mean fluorescence intensity. (J) Median frequencies or expression of indicated populations and markers. Box plots show the 25th and 75th percentiles. p < 0.05, ∗∗p < 0.01, ∗∗∗p < 0.001, and ∗∗∗∗p < 0.0001, Mann-Whitney test, BH correction. See also Figure S5.
Figure 6
Figure 6
HLA profile links COVID-19 immunopathology to impaired virus recognition (A) Correlogram of all immune features (TPs 1 and 2) with ES COVID-19s versus COVID-19m > 0.3, shown for COVID-19s and HAP. Red arrows highlight immune features unique in COVID-19s (ES versus HAP > 0.4). Black boxes 1–3 highlight highly correlating immune clusters. (B) Correlogram of immune features from TP 1 only with ES COVID-19s versus COVID-19m > 0.3 with HLA score 50. HLA score 50 represents the number of predicted tightly binding SARS-CoV-2 peptides of both HLA alleles of a patient. Red arrows highlight SARS-CoV-2-specific immune features (ES COVID-19s versus HAP > 0.4). (C) Correlogram of immune features from TP 1 only with ES COVID-19s versus COVID-19m > 0.3 with routinely assessed clinical parameters. Red arrows highlight highly correlating parameters. (D) Correlation between LDH and granulocyte counts (TP 1 only) against the severity grade of COVID-19 patients. See also Figure S6.
Figure 7
Figure 7
ACE2 expression in a CD4+ T cell subset increases after ex vivo stimulation (A) Comparison of immune features derived from each leukocyte subpopulation between experimental groups. A dot plot displaying the ES calculated in HAP versus COVID-19s (x axis) compared with the ES calculated in COVID-19m versus COVID-19s (y axis). Each dot represents one immunological feature. The red box highlights the immune feature focused in this figure. (B) Median expression of indicated markers in FlowSOM-derived clusters of unstimulated samples. (C) Median frequency and 25th and 75th percentiles of ACE2-positive cells in a subset of unstimulated CXCR3+ CCR6+ (Th1 Th17-enriched) CD4+ T cells. All TPs have been pooled. (D) Median frequency and 25th and 75th percentiles of CXCR3+ CCR6+ (Th1 Th17-enriched) CD4+ T cells at each TP. (E) Representative plot showing ACE2 and isotype staining within the T cell compartment of PMA and ionomycin-restimulated (5 h) COVID-19 samples. (F) Median frequency and 25th and 75th percentiles of ACE2-positive cells in FlowSOM-generated immune cell clusters after PMA and ionomycin restimulation (5 h). All TPs have been pooled. (G) Median expression of various markers in FlowSOM-derived clusters of PMA and ionomycin-restimulated (5 h) samples. (H) Median expression and 25th and 75th percentiles of PD-1 (left panel) and CTLA-4 (right panel) in FlowSOM-generated immune cell clusters after PMA and ionomycin restimulation (5 h). All TPs have been pooled. p < 0.05, ∗∗p < 0.01, ∗∗∗p < 0.001, and ∗∗∗∗p < 0.0001, Mann-Whitney test, BH correction. See also Figure S7.

Comment in

  • Are NKT cells a useful predictor of COVID-19 severity?
    Koay HF, Gherardin NA, Nguyen THO, Zhang W, Habel JR, Seneviratna R, James F, Holmes NE, Smibert OC, Gordon CL, Trubiano JA, Kedzierska K, Godfrey DI. Koay HF, et al. Immunity. 2022 Feb 8;55(2):185-187. doi: 10.1016/j.immuni.2022.01.005. Epub 2022 Jan 19. Immunity. 2022. PMID: 35104438 Free PMC article. No abstract available.

References

    1. Ackermann M., Verleden S.E., Kuehnel M., Haverich A., Welte T., Laenger F., Vanstapel A., Werlein C., Stark H., Tzankov A. Pulmonary vascular endothelialitis, thrombosis, and angiogenesis in COVID-19. N. Engl. J. Med. 2020;383:120–128. - PMC - PubMed
    1. Ahmadzadeh M., Johnson L.A., Heemskerk B., Wunderlich J.R., Dudley M.E., White D.E., Rosenberg S.A. Tumor antigen-specific CD8 T cells infiltrating the tumor express high levels of PD-1 and are functionally impaired. Blood. 2009;114:1537–1544. - PMC - PubMed
    1. Aran D., Looney A.P., Liu L., Wu E., Fong V., Hsu A., Chak S., Naikawadi R.P., Wolters P.J., Abate A.R. Reference-based analysis of lung single-cell sequencing reveals a transitional profibrotic macrophage. Nat. Immunol. 2019;20:163–172. - PMC - PubMed
    1. Armstrong R.A., Kane A.D., Cook T.M. Outcomes from intensive care in patients with COVID-19: a systematic review and meta-analysis of observational studies. Anaesthesia. 2020;75:1340–1349. - PubMed
    1. Arunachalam P.S., Wimmers F., Mok C.K.P., Perera R.A.P.M., Scott M., Hagan T., Sigal N., Feng Y., Bristow L., Tak-Yin Tsang O. Systems biological assessment of immunity to mild versus severe COVID-19 infection in humans. Science. 2020;369:1210–1220. - PMC - PubMed

Publication types

MeSH terms

Associated data