. 2021 Jun 8;54(6):1257-1275.e8.
doi: 10.1016/j.immuni.2021.05.010. Epub 2021 May 16.

Longitudinal analysis reveals that delayed bystander CD8+ T cell activation and early immune pathology distinguish severe COVID-19 from mild disease

Affiliations

Longitudinal analysis reveals that delayed bystander CD8+ T cell activation and early immune pathology distinguish severe COVID-19 from mild disease

Laura Bergamaschi et al. Immunity. .

Abstract

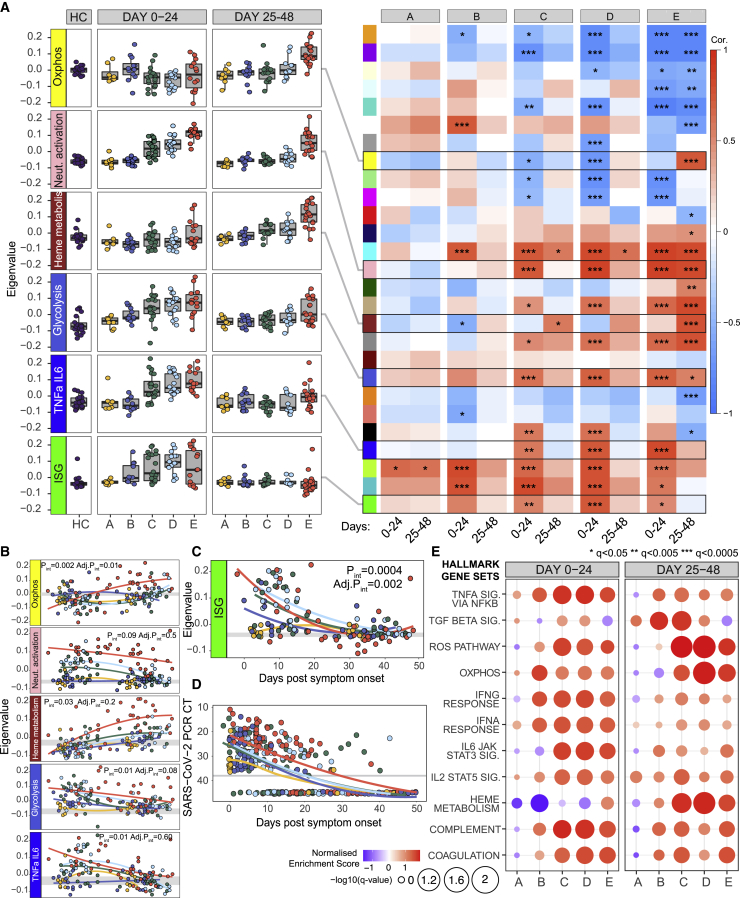
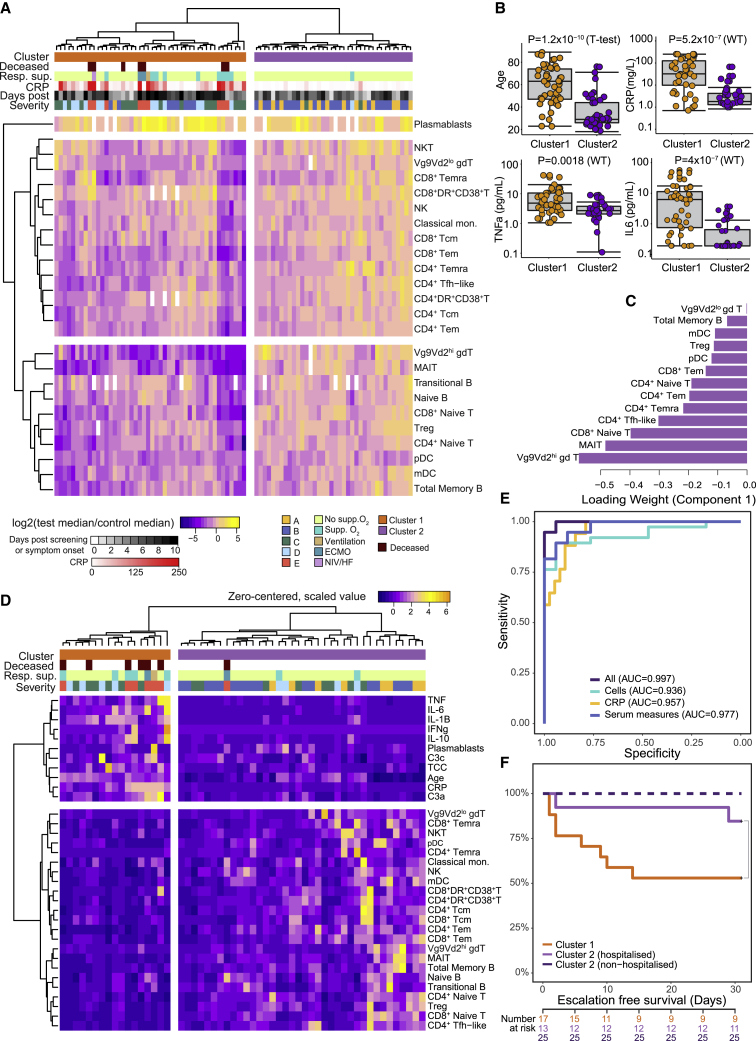
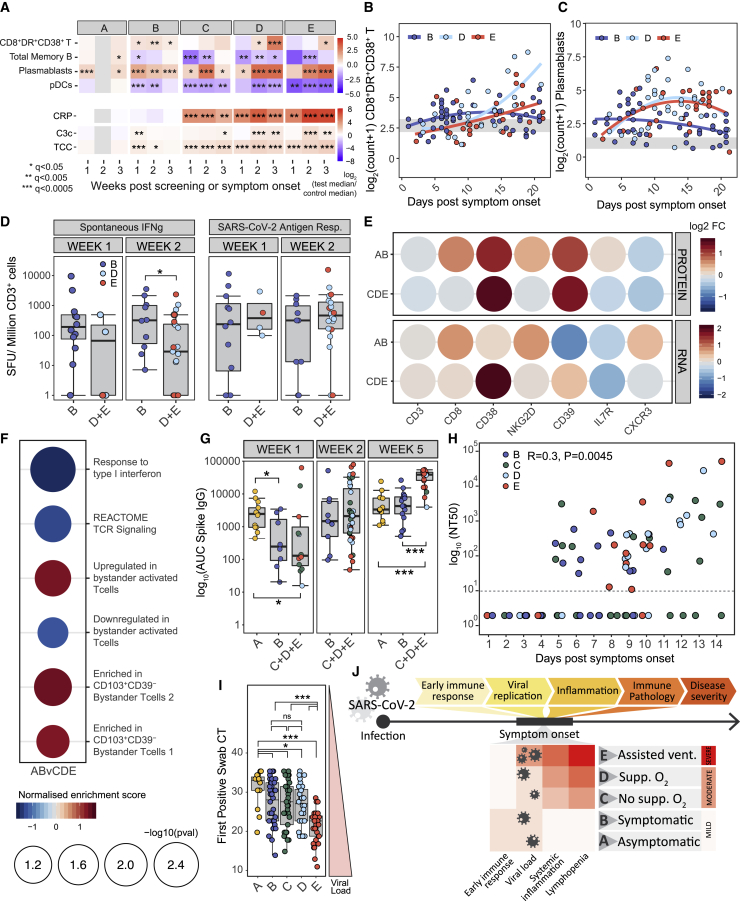
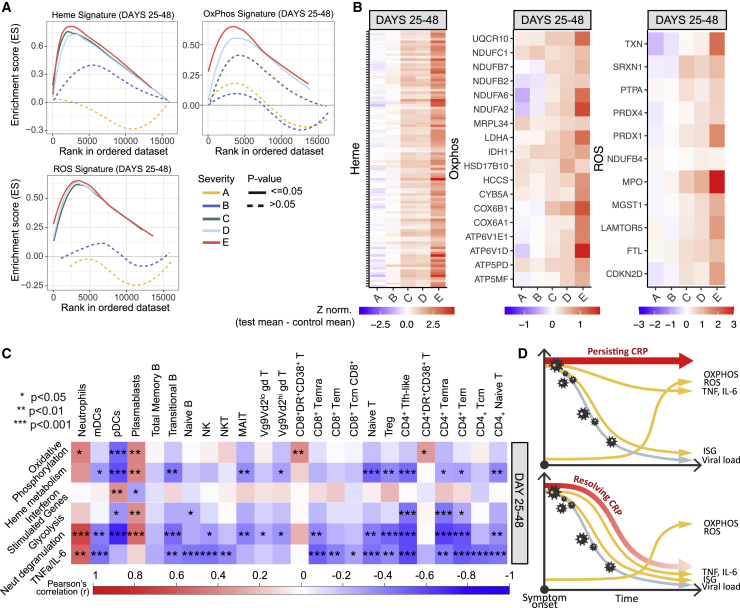
The kinetics of the immune changes in COVID-19 across severity groups have not been rigorously assessed. Using immunophenotyping, RNA sequencing, and serum cytokine analysis, we analyzed serial samples from 207 SARS-CoV2-infected individuals with a range of disease severities over 12 weeks from symptom onset. An early robust bystander CD8+ T cell immune response, without systemic inflammation, characterized asymptomatic or mild disease. Hospitalized individuals had delayed bystander responses and systemic inflammation that was already evident near symptom onset, indicating that immunopathology may be inevitable in some individuals. Viral load did not correlate with this early pathological response but did correlate with subsequent disease severity. Immune recovery is complex, with profound persistent cellular abnormalities in severe disease correlating with altered inflammatory responses, with signatures associated with increased oxidative phosphorylation replacing those driven by cytokines tumor necrosis factor (TNF) and interleukin (IL)-6. These late immunometabolic and immune defects may have clinical implications.

Keywords: COVID-19; SARS-CoV-2; TNF-α; bystander CD8+ T cell; complement; immune pathology; interferon; recovery; systemic inflammation.


Conflict of interest statement

Declaration of interests The authors declare they have no competing interests. E.J.M. Toonen is an employee of Hycult Biotechnology b.v.

Figures

None
Graphical abstract
Figure 1
Figure 1
Cohort characteristics and changes in inflammatory markers over time (A) Study participant and sample numbers split by severity categories and 12-day time bins post screening (group A) or symptom onset (groups B–E). (B and C) Distribution of participant age (B) and gender (C) across severity categories. (D) Boxplots showing CRP (mg/L) and SARS-CoV-2 PCR cycle threshold in 12-day time bins. Gray band, interquartile range of HCs or the SARS-CoV-2 swab cycle negative threshold (CT > 38). (E) Heatmap showing log2 fold change in median CRP and serum cytokine and complement measures between COVID-19 cases and HCs, 12-day time bins. Wilcoxon test FDR adjusted p value: p < 0.05, ∗∗p < 0.005, ∗∗∗p < 0.0005. See also Figure S1 and Table S1.
Figure 2
Figure 2
Profound immune abnormalities in moderate/severe COVID-19 (A) Boxplots showing absolute counts (cells/μL) for two representative cell populations, by severity groups and 12-day time bins post screening (group A) or symptom onset (groups B–E). Gray band; interquartile range of HCs. (B) Heatmap showing the log2 fold change in median absolute cell count (left) or proportion of major subset (right) between COVID-19 cases (samples, n = 362) and HCs (n = 45), 12-day time bins. Wilcoxon test FDR adjusted p value: p < 0.05, ∗∗p < 0.005, ∗∗∗p < 0.0005. Population hierarchy is shown to the left. Population proportions are calculated within parent populations listed to the right. PB or PBMC, peripheral blood mononuclear cells (flow cytometry); WB, whole blood (CyTOF). See also Figure S3 and Data S2.
Figure 3
Figure 3
Whole-blood transcriptomic signatures over time (n = 183) (A) Heatmap derived from WGCNA, correlating whole-blood co-expression gene modules (colored blocks, y axis) with COVID-19 severity groups (x axis) in 24-day time bins post screening (group A) or symptom onset (groups B–E). Boxes are colored by strength of correlation. For details of annotation (by Enrichr) and gene content of all modules, see Figure S4 and Table S3. Boxplots show eigenvalues within key transcriptomic modules, according to disease severity and time. (B) Mixed-effects model with quadratic time trend showing the longitudinal expression of eigengenes over time by severity. Gray band, interquartile range of HCs. Nominal and adjusted p values for the time × severity group interaction term shown. (C and D) Mixed-effects model showing longitudinal expression of eigengene capturing interferon-stimulated genes (ISG) (C) and equivalent mixed-model showing changes in SARS-CoV-2 PCR cycle threshold (viral load) by time and severity (D). y axis inverted in (D). (E) GSEA enrichment for Hallmark genesets against HC in COVID-19 cases split by severity in 24-day time bins post screening (group A) or symptom onset (groups B–E). FDR adjusted p value is shown by circle diameter, with color representing normalized enrichment score of the associated gene set. See also Figure S4 and Table S3.
Figure 4
Figure 4
Multivariate analysis of immune-cell populations in early disease correlates with clinical outcome (A) Unsupervised clustering of absolute cell counts across 24 cell populations (normalized to the median of HCs) for COVID-19 samples taken ≤10 days from screening (group A) or symptom onset (groups B–E). Cases group into two clusters (cluster 1, orange, n = 46; cluster 2, purple, n = 38) by Euclidean distance and Ward D hierarchical clustering. (B) Boxplots comparing age and inflammatory characteristics of individuals in clusters 1 and 2 at the time of sampling. (C) Thirteen cell types selected by sPLS-DA as most informative in predictive models discriminating patients in clusters 1 and 2. Bars indicate loading coefficient weights of selected features (ranked from most to least informative in cluster prediction, from bottom to top). (D) Addition of age, CRP, serum cytokine, and complement measures to unsupervised clustering of cellular data in (A) results in tighter grouping of COVID-19 patients by severity (cluster 1, orange, n = 17. cluster 2, purple, n = 38). (E) AUROC curve showing sensitivity and specificity of severity group prediction (derived from clustering in D), based on absolute counts of 24 key cell types, CRP, or serum measures alone compared to all available measures. (F) Kaplan-Meier plot of escalation-free survival in individuals within severity cluster 1 or cluster 2 split by hospitalization status. Escalation defined as a step up in respiratory support or death. p value for the chi-square test of the difference between cluster 1 (n = 17) and hospitalized patients in cluster 2 (n = 13) is shown; numbers denote non-escalated patients in each group from days 0 to 30 post symptom onset. See also Figure S5 and Data S3.
Figure 5
Figure 5
Early immune changes associated with mild or severe disease outcome (A) Heatmap showing the log2 fold change in median absolute cell counts, CRP or complement measures between COVID-19 cases and HCs by severity and in 7-day time bins post screening (group A) or symptom onset (groups B–E). Wilcoxon test FDR adjusted p value: p < 0.05, ∗∗p < 0.005, ∗∗∗p < 0.0005. (B and C) Mixed-effect model with quadratic time trend showing cellular trajectories over time in sample groups B, D, and E in non-naive HLA-DR+CD38+ CD8 T cells (B) or plasmablasts (C) (cells/μL) from weeks 1–3 post symptom onset (samples, n = 207). (D) Number of CD3+ T cells secreting IFN-γ spontaneously or following SARS-CoV-2 antigen stimulation in samples from groups B (n = 22) and D and E combined (n = 25), 1 or 2 weeks post symptom onset. Kruskal-Wallis test p values: p < 0.05. (E) Log2 fold change (FC) in expression of CD8+ T cell transcripts reflecting T cell activation and surface protein expression (detected by antibody staining) in CITE-seq data from non-naive CD8+ T cells from patients in groups A and B (n = 5) and C, D, and E combined (n = 13), relative to HCs (n = 11). (F) Normalized gene set enrichment score for gene sets associated with TCR-dependent and bystander T cell activation in single-cell transcriptomic data from non-naive CD8+ T cells from patients in groups A and B versus C, D, and E. FDR adjusted p value shown by circle diameter. (G) Area under the curve for SARS-CoV-2 spike-specific IgG titers at 1, 2, and 5 weeks post screening (group A) or symptom onset (groups B–E). Groups C, D, and E are combined to increase statistical power, Kruskal-Wallis test p values annotated as in (A). (H) SARS-CoV-2 antibody titers achieving 50% neutralization (NT50) in patients from groups B–E in the first 2 weeks post symptom onset (n = 102). Samples with no detectable neutralizing activity at the lowest dilution (dotted line) are plotted at an arbitrary NT50 of 1. p value and Pearson’s correlation shown. (I) Boxplots showing SARS-Cov-2 viral load, taken as first positive swab PCR CT, in severity groups. Wilcoxon test p values annotated as in (A). (J) Schematic summarizing variation in immune features of SARS-CoV-2 infection across cases of varying disease severity. See also Figure S6.
Figure 6
Figure 6
Cellular and transcriptional trajectories in persisting and resolving disease (n = 263) (A) CRP (mg/L) from groups C, D, and E grouped by persisting and resolving CRP. (B) Mixed-effect model with quadratic time trend showing log2(CRP) trajectories in both patient groups, and the likelihood-ratio test p value for the time × group interaction term. Gray band, interquartile range in HCs. (C) Heatmap showing the log2 fold change in median absolute cell count between COVID-19 cases in groups C, D, and E, split according to persisting or resolving CRP, and HCs. 12-day time bins. Wilcoxon test FDR adjusted p value: p < 0.05, ∗∗p < 0.005, ∗∗∗p < 0.0005. Rate of cell number changes shown by lollipop plot; faster rate of recovery, or deviation from normal, is indicated by increasing stem length. Points are colored by log2 fold change in median absolute cell counts from HCs at 0–12 days; black outline indicates failure to recover to HC numbers within 60 days (defined in STAR Methods). (D) Mixed-effect models showing longitudinal trajectories of gene module eigenvalues capturing neutrophil degranulation, interferon-stimulated genes, heme metabolism, and oxidative phosphorylation in CRP groups, p values reported as (B).
Figure 7
Figure 7
Altered transcriptional changes in prolonged disease (n = 183) (A) Enrichment score for Hallmark genesets capturing heme metabolism, OXPHOS- and ROS-related genes (by GSEA) in groups A–E in samples taken 25–48 days post screening (group A) or symptom onset (groups B–E). (B) Heatmap showing relative expression of the intersection of GSEA leading edge genes from groups C, D, and E, across severity groups in samples taken 25–48 days post screening (group A) or symptom onset (groups B–E). (C) Heatmap showing correlation between transcriptional eigengenes and absolute cell counts, at 25–48 days post symptom onset. Boxes are colored by strength of correlation, Pearson correlation p values: p < 0.05, ∗∗p < 0.01, ∗∗∗p < 0.001. (D) Schematic representation of the trajectory of immunological changes in SARS-CoV-2 infection over time in patients with persisting or resolving systemic inflammation. See also Figure S7.

Similar articles

Cited by

References

    1. Akbari P., Vuckovic D., Jiang T., Kundu K., Kreuzhuber R., Bao E.L., Mayer L., Collins J.H., Downes K., Georges M. Genetic Analyses of Blood Cell Structure for Biological and Pharmacological Inference. bioRxiv. 2020 doi: 10.1101/2020.01.30.927483. - DOI
    1. Antin J.H., Emerson S.G., Martin P., Gadol N., Ault K.A. Leu-1+ (CD5+) B cells. A major lymphoid subpopulation in human fetal spleen: phenotypic and functional studies. J. Immunol. 1986;136:505–510. - PubMed
    1. Arunachalam P.S., Wimmers F., Mok C.K.P., Perera R.A.P.M., Scott M., Hagan T., Sigal N., Feng Y., Bristow L., Tak-Yin Tsang O. Systems biological assessment of immunity to mild versus severe COVID-19 infection in humans. Science. 2020;369:1210–1220. - PMC - PubMed
    1. Banchereau R., Cepika A.M., Banchereau J., Pascual V. Understanding Human Autoimmunity and Autoinflammation Through Transcriptomics. Annu. Rev. Immunol. 2017;35:337–370. - PMC - PubMed
    1. Bantug G.R., Galluzzi L., Kroemer G., Hess C. The spectrum of T cell metabolism in health and disease. Nat. Rev. Immunol. 2018;18:19–34. - PubMed

Publication types

MeSH terms