

Cadherin-11, Sparc-related modular calcium binding protein-2, and Pigment epithelium-derived factor are promising non-invasive biomarkers of kidney fibrosis
- PMID: 34051265
- PMCID: PMC8384690
- DOI: 10.1016/j.kint.2021.04.037
Cadherin-11, Sparc-related modular calcium binding protein-2, and Pigment epithelium-derived factor are promising non-invasive biomarkers of kidney fibrosis
Abstract
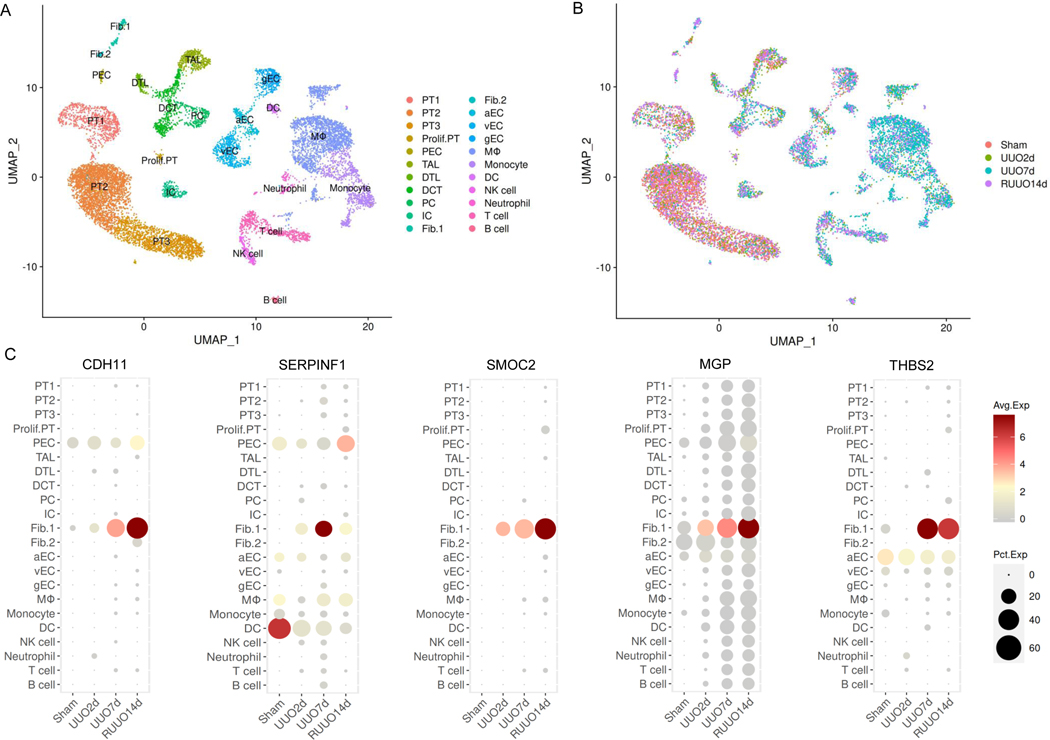
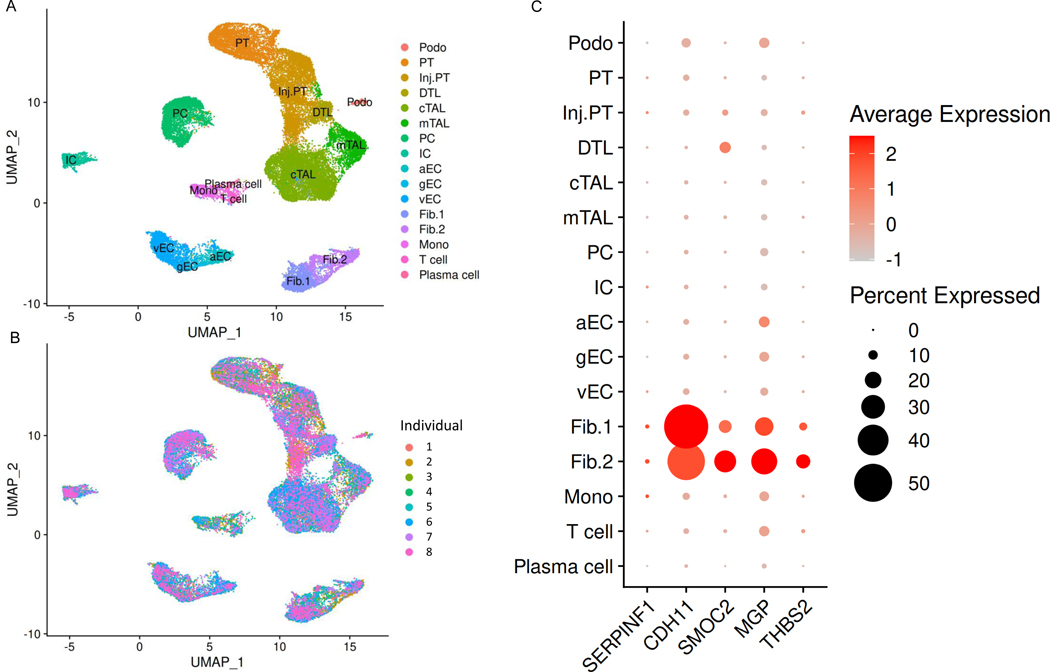
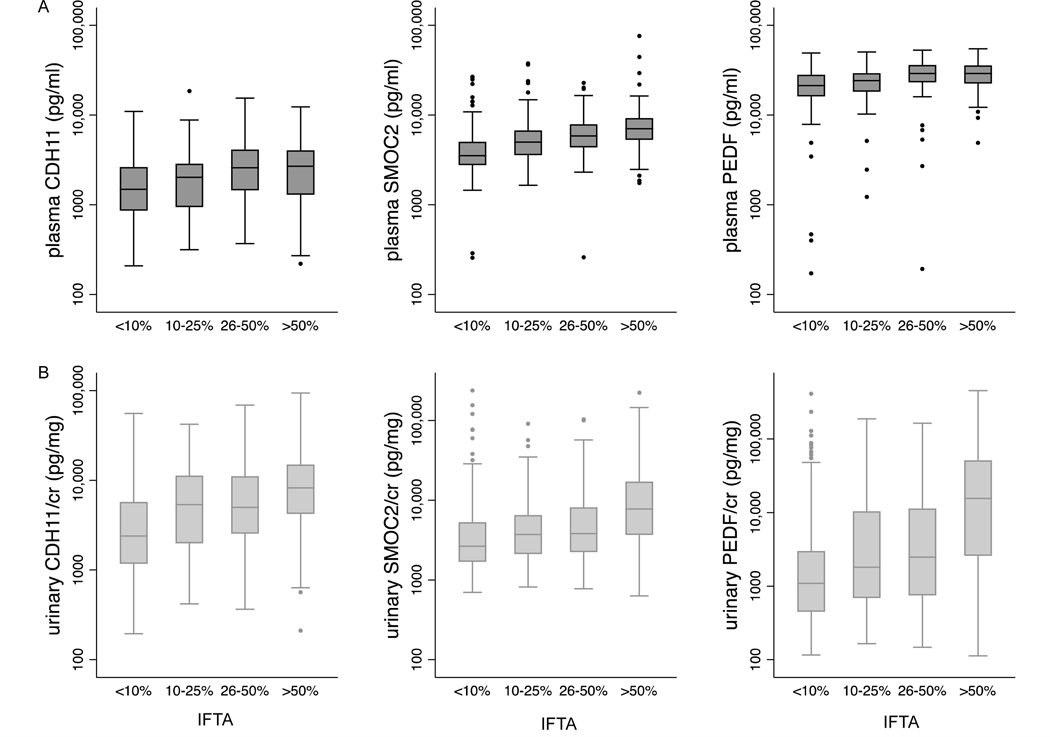
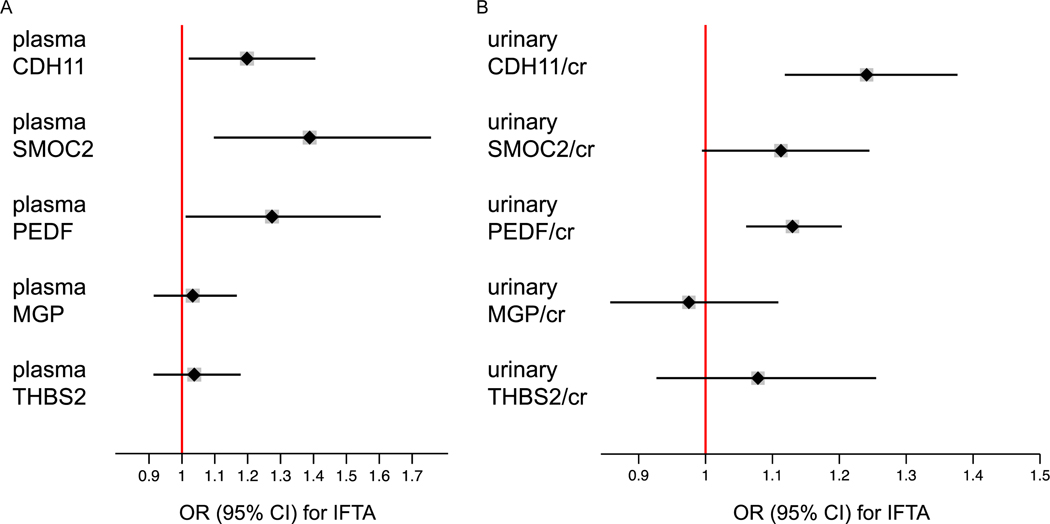
Kidney fibrosis constitutes the shared final pathway of nearly all chronic nephropathies, but biomarkers for the non-invasive assessment of kidney fibrosis are currently not available. To address this, we characterize five candidate biomarkers of kidney fibrosis: Cadherin-11 (CDH11), Sparc-related modular calcium binding protein-2 (SMOC2), Pigment epithelium-derived factor (PEDF), Matrix-Gla protein, and Thrombospondin-2. Gene expression profiles in single-cell and single-nucleus RNA-sequencing (sc/snRNA-seq) datasets from rodent models of fibrosis and human chronic kidney disease (CKD) were explored, and Luminex-based assays for each biomarker were developed. Plasma and urine biomarker levels were measured using independent prospective cohorts of CKD: the Boston Kidney Biopsy Cohort, a cohort of individuals with biopsy-confirmed semiquantitative assessment of kidney fibrosis, and the Seattle Kidney Study, a cohort of patients with common forms of CKD. Ordinal logistic regression and Cox proportional hazards regression models were used to test associations of biomarkers with interstitial fibrosis and tubular atrophy and progression to end-stage kidney disease and death, respectively. Sc/snRNA-seq data confirmed cell-specific expression of biomarker genes in fibroblasts. After multivariable adjustment, higher levels of plasma CDH11, SMOC2, and PEDF and urinary CDH11 and PEDF were significantly associated with increasing severity of interstitial fibrosis and tubular atrophy in the Boston Kidney Biopsy Cohort. In both cohorts, higher levels of plasma and urinary SMOC2 and urinary CDH11 were independently associated with progression to end-stage kidney disease. Higher levels of urinary PEDF associated with end-stage kidney disease in the Seattle Kidney Study, with a similar signal in the Boston Kidney Biopsy Cohort, although the latter narrowly missed statistical significance. Thus, we identified CDH11, SMOC2, and PEDF as promising non-invasive biomarkers of kidney fibrosis.
Keywords: biomarker; biopsy; fibrosis; histopathology; kidney disease.
Copyright © 2021 International Society of Nephrology. Published by Elsevier Inc. All rights reserved.
Figures
References
-
- Humphreys BD. Mechanisms of Renal Fibrosis. Annu Rev Physiol. 2018;80:309–326. - PubMed
Publication types
MeSH terms
Substances
Grants and funding
- K24 DK103986/DK/NIDDK NIH HHS/United States
- R01 DK107931/DK/NIDDK NIH HHS/United States
- R56 ES017543/ES/NIEHS NIH HHS/United States
- UH3 DK114923/DK/NIDDK NIH HHS/United States
- UH3 DK114908/DK/NIDDK NIH HHS/United States
- U2C DK114886/DK/NIDDK NIH HHS/United States
- UH3 DK114915/DK/NIDDK NIH HHS/United States
- UG3 DK114907/DK/NIDDK NIH HHS/United States
- UH3 DK114861/DK/NIDDK NIH HHS/United States
- U01 DK114933/DK/NIDDK NIH HHS/United States
- UH3 DK114866/DK/NIDDK NIH HHS/United States
- R21 DK119751/DK/NIDDK NIH HHS/United States
- UH3 DK114933/DK/NIDDK NIH HHS/United States
- R01 DK103784/DK/NIDDK NIH HHS/United States
- U24 DK114886/DK/NIDDK NIH HHS/United States
- U01 DK085660/DK/NIDDK NIH HHS/United States
- R01 ES017543/ES/NIEHS NIH HHS/United States
- UH3 DK114907/DK/NIDDK NIH HHS/United States
- UH3 DK114920/DK/NIDDK NIH HHS/United States
- U01 DK104308/DK/NIDDK NIH HHS/United States
- UH3 DK114926/DK/NIDDK NIH HHS/United States
- UH3 DK114937/DK/NIDDK NIH HHS/United States
- UH3 DK114870/DK/NIDDK NIH HHS/United States
- U01 DK114907/DK/NIDDK NIH HHS/United States
- UG3 DK114861/DK/NIDDK NIH HHS/United States
- K23 DK120811/DK/NIDDK NIH HHS/United States
- UL1 TR001102/TR/NCATS NIH HHS/United States
- R01 DK103598/DK/NIDDK NIH HHS/United States
- P30 DK020572/DK/NIDDK NIH HHS/United States
- P30 DK114857/DK/NIDDK NIH HHS/United States
LinkOut - more resources
Full Text Sources
Other Literature Sources
Miscellaneous
