

Tumor Necrosis Factor-alpha Blockade Improves Uterine Artery Resistance, Maternal Blood Pressure, and Fetal Growth in Placental Ischemic Rats
- PMID: 34051437
- PMCID: PMC8363517
- DOI: 10.1016/j.preghy.2021.05.002
Tumor Necrosis Factor-alpha Blockade Improves Uterine Artery Resistance, Maternal Blood Pressure, and Fetal Growth in Placental Ischemic Rats
Abstract
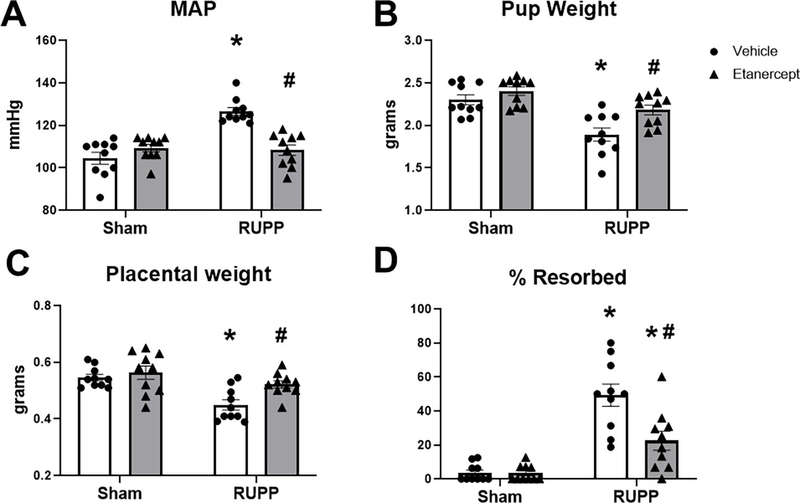
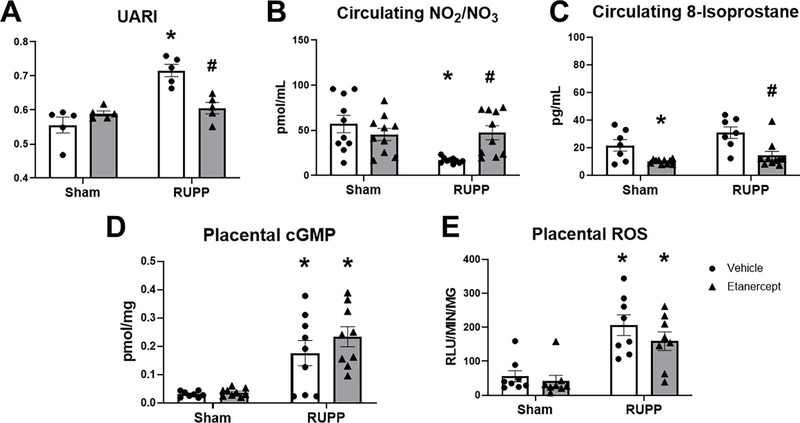
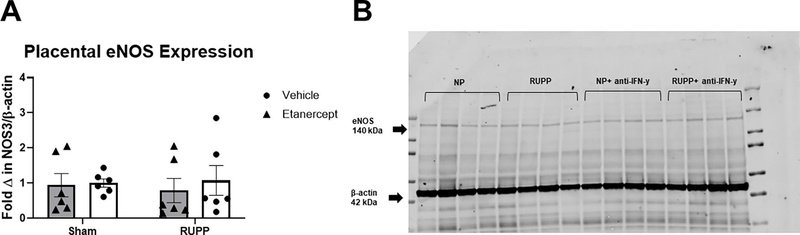
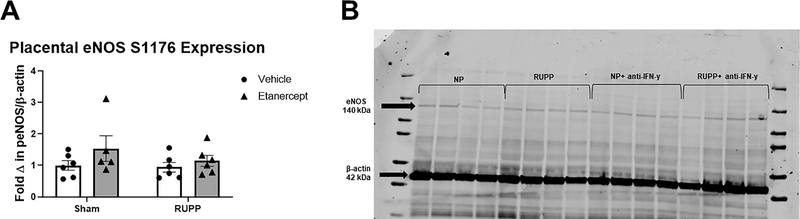
We recently reported that adoptive transfer of cytolytic Natural Killer cells (cNKs) from the Reduced Uterine Perfusion Pressure (RUPP) rat induces a preeclampsia (PE)-like phenotype in pregnant rats, accompanied by increased TNF-α. The purpose of this study was to investigate a role for increased TNF-α to induce oxidative stress (ROS), decrease nitric oxide (NO) bioavailability, and induce vascular dysfunction as mechanisms of hypertension (HTN) and intrauterine growth restriction (IUGR) in RUPPs. Pregnant Sprague Dawley rats underwent the RUPP or a Sham procedure on gestation day (GD) 14. On GDs 15 and 18, a subset of Sham and RUPP rats received i.p.injections of vehicle or 0.4 mg/kg of Etanercept (ETA), a soluble TNF-α receptor (n = 10/group). On GD18, Uterine Artery Resistance Index (UARI) was measured, and on GD19, mean arterial pressure (MAP), fetal and placental weights were measured, and blood and tissues were processed for analysis. TNF-α blockade normalized the elevated MAP observed RUPP. Additionally, both fetal and placental weights were decreased in RUPP compared to Sham, and were normalized in RUPP + ETA. Placental ROS was also increased in RUPP rats compared to Sham, and remained elevated in RUPP + ETA. Compared to Sham, UARI was elevated in RUPPs while plasma total nitrate was reduced, and these were normalized in ETA treated RUPPs. In conclusion, TNF-α blockade in RUPPs reduced MAP and UARI, improved fetal growth, and increased NO bioavailability. These data suggest that TNF-α regulation of NO bioavailability is a potential mechanism that contributes to PE pathophysiology and may represent a therapeutic target to improve maternal outcomes and fetal growth.
Keywords: Inflammation; Intrauterine Growth Restriction; Preeclampsia; Tumor Necrosis Factor-alpha.
Copyright © 2021 International Society for the Study of Hypertension in Pregnancy. Published by Elsevier B.V. All rights reserved.
Conflict of interest statement
DECLARATIONS OF INTEREST
No conflicts of interest, financial or otherwise, are declared by the authors.
Figures
Similar articles
-
Interferon γ neutralization reduces blood pressure, uterine artery resistance index, and placental oxidative stress in placental ischemic rats.Am J Physiol Regul Integr Comp Physiol. 2021 Aug 1;321(2):R112-R124. doi: 10.1152/ajpregu.00349.2020. Epub 2021 Jun 2. Am J Physiol Regul Integr Comp Physiol. 2021. PMID: 34075808 Free PMC article.
-
Adoptive transfer of placental ischemia-stimulated natural killer cells causes a preeclampsia-like phenotype in pregnant rats.Am J Reprod Immunol. 2021 Jun;85(6):e13386. doi: 10.1111/aji.13386. Epub 2020 Dec 27. Am J Reprod Immunol. 2021. PMID: 33315281 Free PMC article.
-
Natural killer cells mediate pathophysiology in response to reduced uterine perfusion pressure.Clin Sci (Lond). 2017 Nov 23;131(23):2753-2762. doi: 10.1042/CS20171118. Print 2017 Dec 1. Clin Sci (Lond). 2017. PMID: 29042488 Free PMC article.
-
Serelaxin improves the pathophysiology of placental ischemia in the reduced uterine perfusion pressure rat model of preeclampsia.Am J Physiol Regul Integr Comp Physiol. 2016 Dec 1;311(6):R1158-R1163. doi: 10.1152/ajpregu.00192.2016. Epub 2016 Sep 14. Am J Physiol Regul Integr Comp Physiol. 2016. PMID: 27629886 Free PMC article.
-
Interleukin-4 supplementation improves the pathophysiology of hypertension in response to placental ischemia in RUPP rats.Am J Physiol Regul Integr Comp Physiol. 2019 Feb 1;316(2):R165-R171. doi: 10.1152/ajpregu.00167.2018. Epub 2019 Jan 9. Am J Physiol Regul Integr Comp Physiol. 2019. PMID: 30624978 Free PMC article.
Cited by
-
Setting a stage: Inflammation during preeclampsia and postpartum.Front Physiol. 2023 Feb 23;14:1130116. doi: 10.3389/fphys.2023.1130116. eCollection 2023. Front Physiol. 2023. PMID: 36909242 Free PMC article. Review.
-
NLRP3 inhibition improves maternal hypertension, inflammation, and vascular dysfunction in response to placental ischemia.Am J Physiol Regul Integr Comp Physiol. 2023 Apr 1;324(4):R556-R567. doi: 10.1152/ajpregu.00192.2022. Epub 2023 Feb 27. Am J Physiol Regul Integr Comp Physiol. 2023. PMID: 36847598 Free PMC article.
-
Placental Ischemia Says "NO" to Proper NOS-Mediated Control of Vascular Tone and Blood Pressure in Preeclampsia.Int J Mol Sci. 2021 Oct 19;22(20):11261. doi: 10.3390/ijms222011261. Int J Mol Sci. 2021. PMID: 34681920 Free PMC article. Review.
-
Uteroplacental Circulation in Normal Pregnancy and Preeclampsia: Functional Adaptation and Maladaptation.Int J Mol Sci. 2021 Aug 11;22(16):8622. doi: 10.3390/ijms22168622. Int J Mol Sci. 2021. PMID: 34445328 Free PMC article. Review.
-
Tumor Necrosis Factor Inhibitor Use Increases Birthweight in Pregnant Women With Rheumatoid Arthritis Independently of the Soluble Fms-Like Tyrosine Kinase-1/Placental Growth Factor Ratio.J Am Heart Assoc. 2024 Apr 2;13(7):e032655. doi: 10.1161/JAHA.123.032655. Epub 2024 Mar 27. J Am Heart Assoc. 2024. PMID: 38533985 Free PMC article.
References
-
- Roberts JM, Preeclampsia: what we know and what we do not know, Semin Perinatol 24(1) (2000) 24–8. - PubMed
-
- Hladunewich M, Karumanchi SA, Lafayette R, Pathophysiology of the clinical manifestations of preeclampsia, Clin J Am Soc Nephrol 2(3) (2007) 543–9. - PubMed
-
- Young BC, Levine RJ, Karumanchi SA, Pathogenesis of preeclampsia, Annu Rev Pathol 5 (2010) 173–92. - PubMed
MeSH terms
Substances
Grants and funding
LinkOut - more resources
Full Text Sources
Other Literature Sources
