Multicenter Study
. 2021 Aug:72:102096.
doi: 10.1016/j.media.2021.102096. Epub 2021 May 12.

Deep learning for predicting COVID-19 malignant progression

Affiliations
Multicenter Study

Deep learning for predicting COVID-19 malignant progression

Cong Fang et al. Med Image Anal. 2021 Aug.

Abstract

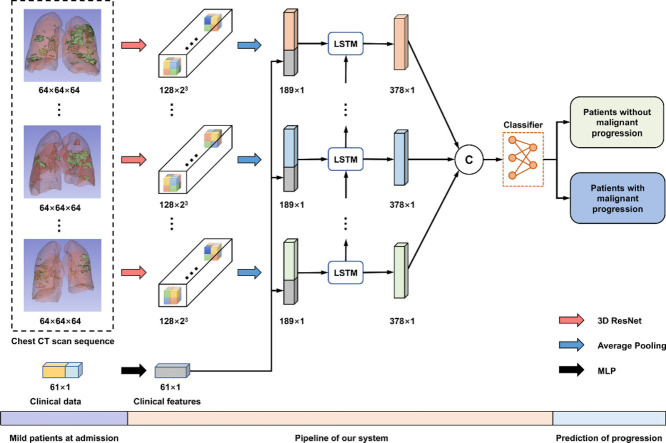
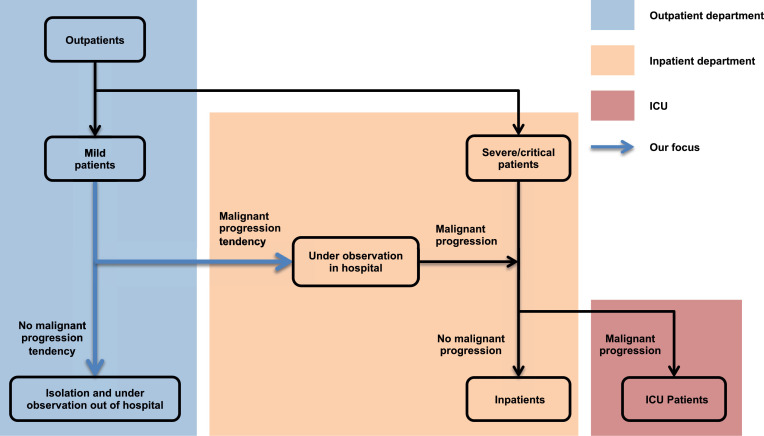
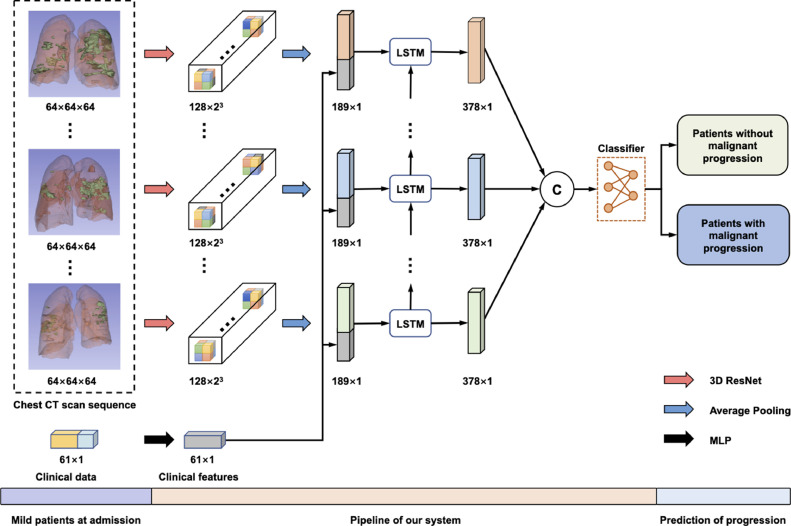
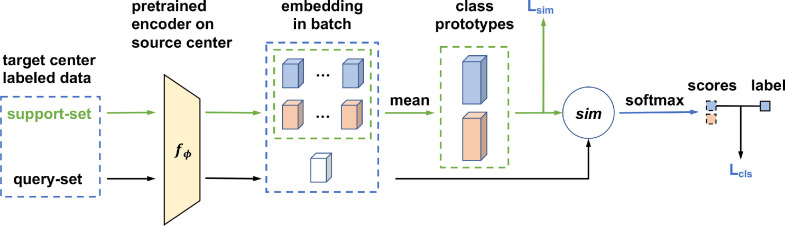
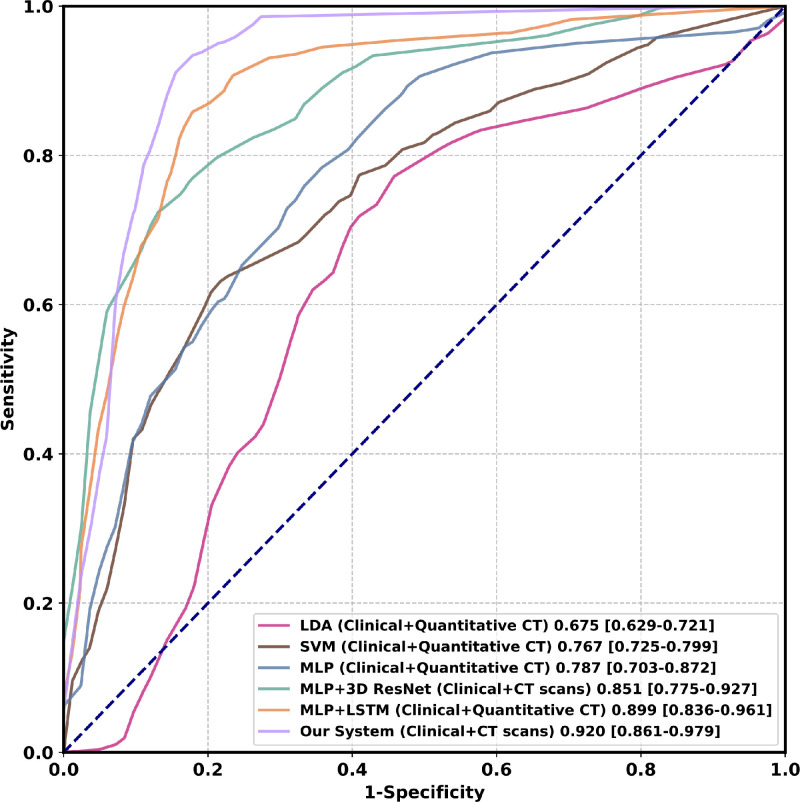
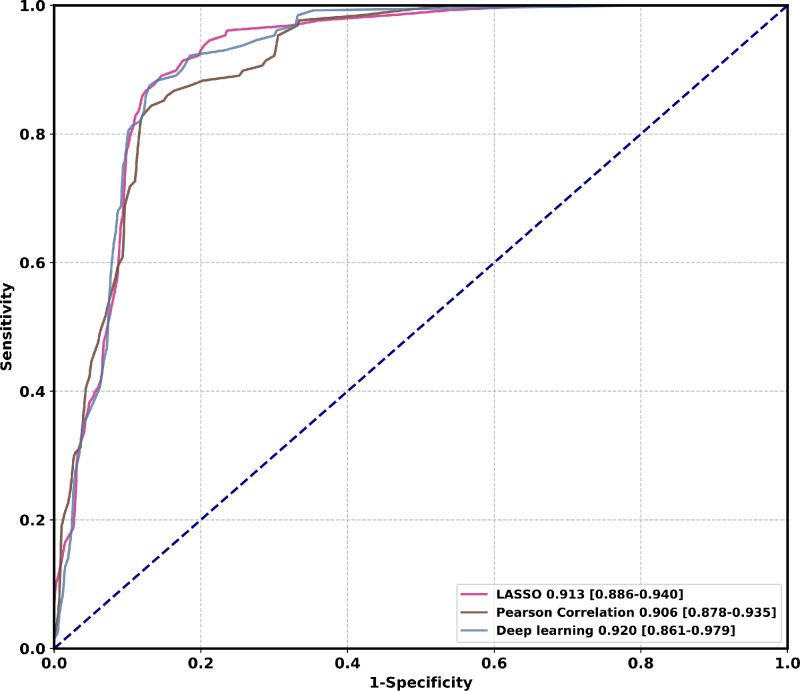
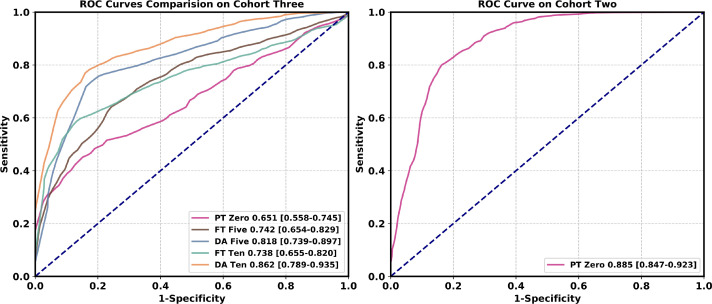
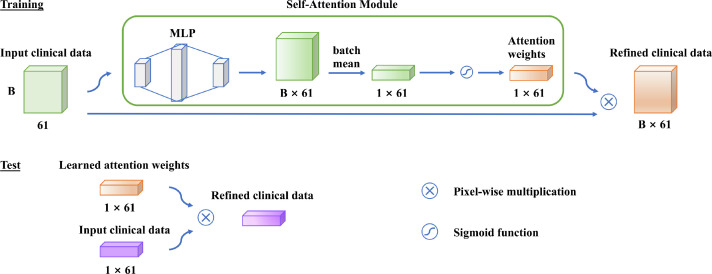
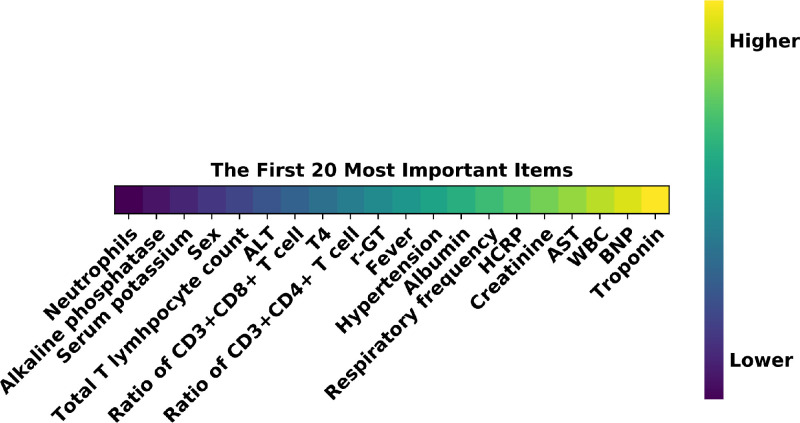
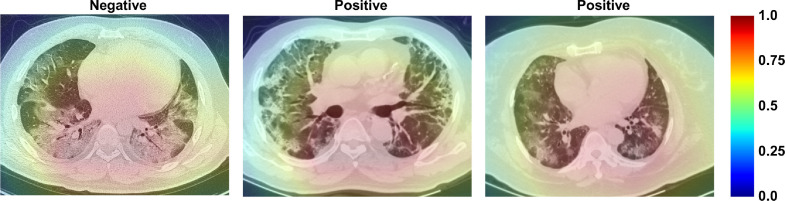
As COVID-19 is highly infectious, many patients can simultaneously flood into hospitals for diagnosis and treatment, which has greatly challenged public medical systems. Treatment priority is often determined by the symptom severity based on first assessment. However, clinical observation suggests that some patients with mild symptoms may quickly deteriorate. Hence, it is crucial to identify patient early deterioration to optimize treatment strategy. To this end, we develop an early-warning system with deep learning techniques to predict COVID-19 malignant progression. Our method leverages CT scans and the clinical data of outpatients and achieves an AUC of 0.920 in the single-center study. We also propose a domain adaptation approach to improve the generalization of our model and achieve an average AUC of 0.874 in the multicenter study. Moreover, our model automatically identifies crucial indicators that contribute to the malignant progression, including Troponin, Brain natriuretic peptide, White cell count, Aspartate aminotransferase, Creatinine, and Hypersensitive C-reactive protein.

Keywords: COVID-19; Domain adaptation; Feature fusion; Malignant progression.


Conflict of interest statement

Declaration of Competing Interest The authors declare that they have no known competing financial interests or personal relationships that could have appeared to influence the work reported in this paper.

Figures

None
Graphical abstract
Fig. 1
Fig. 1
Patient stratification from outpatients to ICU. Reasonable hierarchical management of COVID-19 patients is beneficial to optimizing the allocation of medical resources and improving the efficiency of diagnosis and treatment.
Fig. 2
Fig. 2
Flowchart of patient selection. A total of 1,040 out of 2,742 patients are selected according to the inclusion criteria. All the 1,040 patients have the complete clinical data required for the study and 57.9% of them underwent serial chest CT imaging. Abbreviations: Respiratory rate (RR); Blood oxygen saturation (SpO2); Arterial oxygen partial pressure (PaO2), Fraction of inspiration oxygen (FiO2).
Fig. 3
Fig. 3
The pipeline of our system about the prediction of COVID-19 malignant progression. First, 3D ResNet and MLP encode chest CT scans and the clinical data, respectively. Then, we combine the two features and feed them into an LSTM to model the temporal information. Finally, several fully connected layers are exploited to make the prediction. Abbreviations: Computed Tomography (CT); Long Short-Term Memory (LSTM); Multilayer Perceptron (MLP).
Fig. 4
Fig. 4
Multicenter domain adaptation process. First, we pre-train an encoder on the source center, and then, adapt the model through a metric-based approach, passing the prototype representation learned from the source center to the target center.
Fig. 5
Fig. 5
Comparison of ROC curves among different methods on the cohort one. Numbers after parentheses are AUCs. Numbers in brackets are confidence intervals. Figure best viewed in color. Abbreviations: Linear Discriminant Analysis (LDA); Support Vector Machine (SVM); Multilayer Perceptron (MLP); Long Short-Term Memory (LSTM). (For interpretation of the references to color in this figure legend, the reader is referred to the web version of this article.)
Fig. 6
Fig. 6
Comparison of ROC curves among different feature selection algorithms on the cohort one. Numbers before brackets are AUCs. Numbers in brackets are confidence intervals. Figure best viewed in color. Abbreviations: Least Absolute Shrinkage and Selection Operator (LASSO). (For interpretation of the references to color in this figure legend, the reader is referred to the web version of this article.)
Fig. 7
Fig. 7
Comparison of ROC curves among different methods in the multicenter study. In each class, the same number of samples are used during the domain adaptation process. Numbers before brackets are AUCs. Numbers in brackets are confidence intervals. Figure best viewed in color. Abbreviations: pre-trained (PT); fine-tuning (FT); domain adaptation (DA). (For interpretation of the references to color in this figure legend, the reader is referred to the web version of this article.)
Fig. 8
Fig. 8
Self-attention module for prognostic factors. B × 61 represents the batch size and the length of the vector. Abbreviations: Multilayer Perceptron (MLP).
Fig. 9
Fig. 9
The top prognostic factors of the clinical data. Figure best viewed in color. Abbreviations: Alanine aminotransferase (ALT); γ-Glutamyl transpeptidase (r-GT); Hypersensitive C-reactive protein (HCRP); Aspartate aminotransferase (AST); White blood cell (WBC); Brain natriuretic peptide (BNP). (For interpretation of the references to color in this figure legend, the reader is referred to the web version of this article.)
Fig. 10
Fig. 10
Visualization of learned activation maps for COVID-19 patients with mild symptoms. Red regions correspond to high score for class, and our system localizes class-discriminative regions. Figure best viewed in color. (For interpretation of the references to color in this figure legend, the reader is referred to the web version of this article.)

References

    1. Alqahtani S.A., Schattenberg J.M. Liver injury in COVID-19: the current evidence. U. Eur. Gastroenterol. J. 2020;8(5):509–519. - PMC - PubMed
    1. Bennhold K. A German exception? Why the country’s coronavirus death rate is low. New York Times. 2020;6(4):2020.
    1. Bermúdez-Chacón R., Becker C.J., Salzmann M., Fua P. MICCAI. 2016. Scalable unsupervised domain adaptation for electron microscopy. - PubMed
    1. Bourgonje A.R., Abdulle A.E., Timens W., Hillebrands J.-L., Navis G.J., Gordijn S.J., Bolling M.C., Dijkstra G., Voors A.A., Osterhaus A.D., et al. Angiotensin-converting enzyme-2 (ACE2), SARS-CoV-2 and pathophysiology of coronavirus disease 2019 (COVID-19) J. Pathol. 2020 - PMC - PubMed
    1. Brown L., Cai T.T., DasGupta A. Interval estimation for a binomial proportion. Stat. Sci. 2001;16:101–133.

Publication types