

Data-driven estimation of COVID-19 community prevalence through wastewater-based epidemiology
- PMID: 34051491
- PMCID: PMC8141262
- DOI: 10.1016/j.scitotenv.2021.147947
Data-driven estimation of COVID-19 community prevalence through wastewater-based epidemiology
Abstract
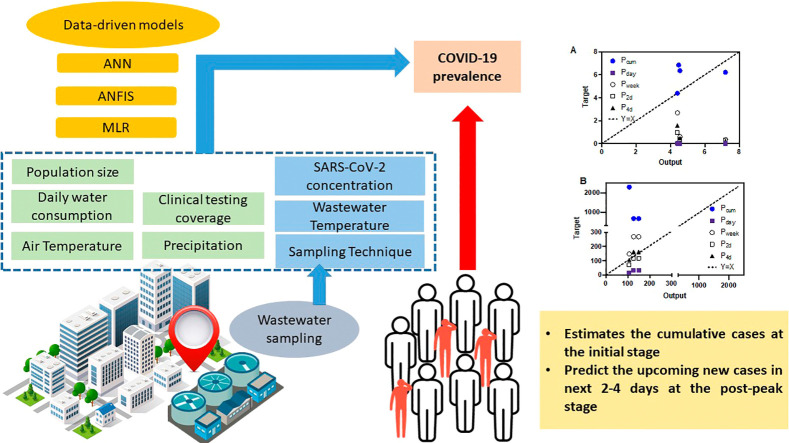
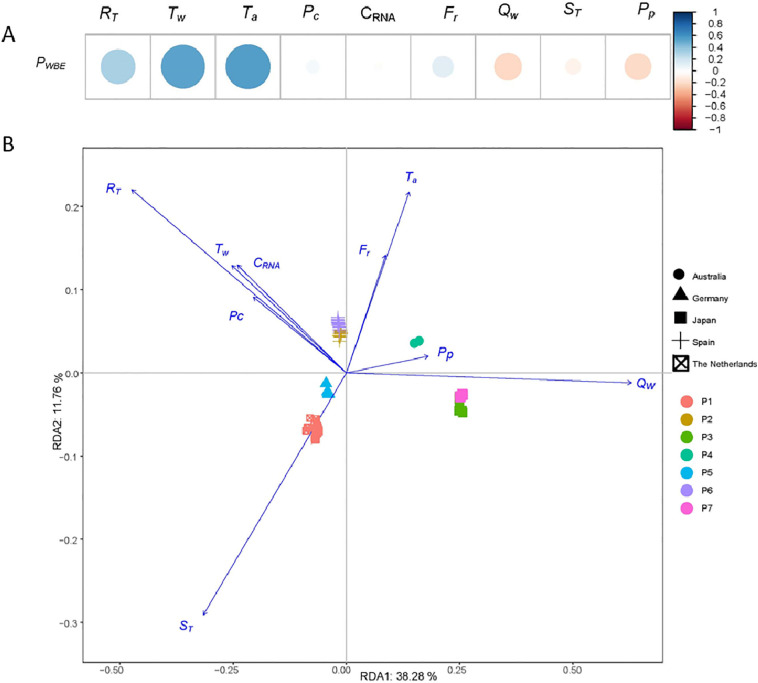
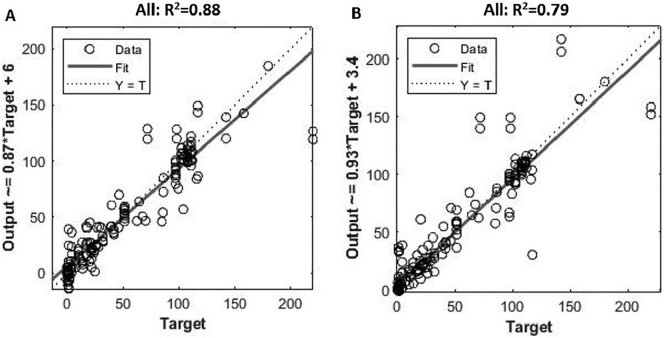
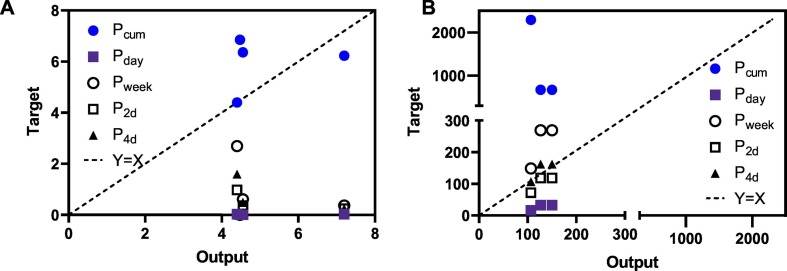
Wastewater-based epidemiology (WBE) has been regarded as a potential tool for the prevalence estimation of coronavirus disease 2019 (COVID-19) in the community. However, the application of the conventional back-estimation approach is currently limited due to the methodological challenges and various uncertainties. This study systematically performed meta-analysis for WBE datasets and investigated the use of data-driven models for the COVID-19 community prevalence in lieu of the conventional WBE back-estimation approach. Three different data-driven models, i.e. multiple linear regression (MLR), artificial neural network (ANN), and adaptive neuro fuzzy inference system (ANFIS) were applied to the multi-national WBE dataset. To evaluate the robustness of these models, predictions for sixteen scenarios with partial inputs were compared against the actual prevalence reports from clinical testing. The performance of models was further validated using unseen data (data sets not included for establishing the model) from different stages of the COVID-19 outbreak. Generally, ANN and ANFIS models showed better accuracy and robustness over MLR models. Air and wastewater temperature played a critical role in the prevalence estimation by data-driven models, especially MLR models. With unseen datasets, ANN model reasonably estimated the prevalence of COVID-19 (cumulative cases) at the initial phase and forecasted the upcoming new cases in 2-4 days at the post-peak phase of the COVID-19 outbreak. This study provided essential information about the feasibility and accuracy of data-driven estimation of COVID-19 prevalence through the WBE approach.
Keywords: Artificial neural network; COVID-19; Data-driven models; SARS-CoV-2; Wastewater-based epidemiology.
Copyright © 2021 Elsevier B.V. All rights reserved.
Conflict of interest statement
Declaration of competing interest The authors declare that they have no known competing financial interests or personal relationships that could have appeared to influence the work reported in this paper.
Figures
Similar articles
-
Artificial neural network-based estimation of COVID-19 case numbers and effective reproduction rate using wastewater-based epidemiology.Water Res. 2022 Jun 30;218:118451. doi: 10.1016/j.watres.2022.118451. Epub 2022 Apr 13. Water Res. 2022. PMID: 35447417 Free PMC article.
-
An exploration of challenges associated with machine learning for time series forecasting of COVID-19 community spread using wastewater-based epidemiological data.Sci Total Environ. 2023 Feb 1;858(Pt 1):159748. doi: 10.1016/j.scitotenv.2022.159748. Epub 2022 Oct 25. Sci Total Environ. 2023. PMID: 36306840 Free PMC article.
-
Computational analysis of SARS-CoV-2/COVID-19 surveillance by wastewater-based epidemiology locally and globally: Feasibility, economy, opportunities and challenges.Sci Total Environ. 2020 Aug 15;730:138875. doi: 10.1016/j.scitotenv.2020.138875. Epub 2020 Apr 22. Sci Total Environ. 2020. PMID: 32371231 Free PMC article.
-
Uncertainties in estimating SARS-CoV-2 prevalence by wastewater-based epidemiology.Chem Eng J. 2021 Jul 1;415:129039. doi: 10.1016/j.cej.2021.129039. Epub 2021 Feb 20. Chem Eng J. 2021. PMID: 33642938 Free PMC article. Review.
-
Making waves: Plausible lead time for wastewater based epidemiology as an early warning system for COVID-19.Water Res. 2021 Sep 1;202:117438. doi: 10.1016/j.watres.2021.117438. Epub 2021 Jul 12. Water Res. 2021. PMID: 34333296 Free PMC article. Review.
Cited by
-
Optimizing campus-wide COVID-19 test notifications with interpretable wastewater time-series features using machine learning models.Sci Rep. 2023 Nov 24;13(1):20670. doi: 10.1038/s41598-023-47859-2. Sci Rep. 2023. PMID: 38001346 Free PMC article.
-
Wastewater-based Epidemiology for COVID-19 Surveillance and Beyond: A Survey.ArXiv [Preprint]. 2024 Sep 23:arXiv:2403.15291v2. ArXiv. 2024. Update in: Epidemics. 2024 Dec;49:100793. doi: 10.1016/j.epidem.2024.100793. PMID: 38562450 Free PMC article. Updated. Preprint.
-
The potential of long-term wastewater-based surveillance to predict COVID-19 waves peak in Mexico.Water Environ Res. 2025 May;97(5):e70095. doi: 10.1002/wer.70095. Water Environ Res. 2025. PMID: 40396702 Free PMC article.
-
Wastewater surveillance as a predictive tool for COVID-19: A case study in Chengdu.PLoS One. 2025 May 28;20(5):e0324521. doi: 10.1371/journal.pone.0324521. eCollection 2025. PLoS One. 2025. PMID: 40435151 Free PMC article.
-
Making waves: Defining the lead time of wastewater-based epidemiology for COVID-19.Water Res. 2021 Sep 1;202:117433. doi: 10.1016/j.watres.2021.117433. Epub 2021 Jul 15. Water Res. 2021. PMID: 34304074 Free PMC article. Review.
References
-
- Ahmed W., Angel N., Edson J., Bibby K., Bivins A., O’Brien J.W., Choi P.M., Kitajima M., Simpson S.L., Li J., Tscharke B., Verhagen R., Smith W.J.M., Zaugg J., Dierens L., Hugenholtz P., Thomas K.V., Mueller J.F. First confirmed detection of SARS-CoV-2 in untreated wastewater in Australia: a proof of concept for the wastewater surveillance of COVID-19 in the community. Sci. Total Environ. 2020;728 - PMC - PubMed
-
- Ahmed W., Bertsch P.M., Bibby K., Haramoto E., Hewitt J., Huygens F., Gyawali P., Korajkic A., Riddell S., Sherchan S.P., Simpson S.L., Sirikanchana K., Symonds E.M., Verhagen R., Vasan S.S., Kitajima M., Bivins A. Decay of SARS-CoV-2 and surrogate murine hepatitis virus RNA in untreated wastewater to inform application in wastewater-based epidemiology. Environ. Res. 2020;191 - PMC - PubMed
-
- Ahmed W., Bertsch P.M., Bivins A., Bibby K., Farkas K., Gathercole A., Haramoto E., Gyawali P., Korajkic A., McMinn B.R., Mueller J.F., Simpson S.L., Smith W.J.M., Symonds E.M., Thomas K.V., Verhagen R., Kitajima M. Comparison of virus concentration methods for the RT-qPCR-based recovery of murine hepatitis virus, a surrogate for SARS-CoV-2 from untreated wastewater. Sci. Total Environ. 2020;739 - PMC - PubMed
-
- Alygizakis N., Markou A.N., Rousis N.I., Galani A., Avgeris M., Adamopoulos P.G., Scorilas A., Lianidou E.S., Paraskevis D., Tsiodras S., Tsakris A., Dimopoulos M.A., Thomaidis N.S. Analytical methodologies for the detection of SARS-CoV-2 in wastewater: protocols and future perspectives. Trends Anal. Chem. 2021;134 - PMC - PubMed
-
- Ausati S., Amanollahi J. Assessing the accuracy of ANFIS, EEMD-GRNN, PCR, and MLR models in predicting PM2. 5. Atmos. Environ. 2016;142:465–474.
Publication types
MeSH terms
Substances
LinkOut - more resources
Full Text Sources
Other Literature Sources
Medical
Miscellaneous
