. 2021 May 29;22(1):286.
doi: 10.1186/s12859-021-03965-4.

Incorporating support vector machine with sequential minimal optimization to identify anticancer peptides

Affiliations

Incorporating support vector machine with sequential minimal optimization to identify anticancer peptides

Yu Wan et al. BMC Bioinformatics. .

Abstract

Background: Cancer is one of the major causes of death worldwide. To treat cancer, the use of anticancer peptides (ACPs) has attracted increased attention in recent years. ACPs are a unique group of small molecules that can target and kill cancer cells fast and directly. However, identifying ACPs by wet-lab experiments is time-consuming and labor-intensive. Therefore, it is significant to develop computational tools for ACPs prediction. Though some ACP prediction tools have been developed recently, their performances are not well enough and most of them do not offer a function to distinguish ACPs from antimicrobial peptides (AMPs). Considering the fact that a growing number of studies have shown that some AMPs exhibit anticancer function, this work tries to build a model for distinguishing AMPs from ACPs in addition to a model that predicts ACPs from whole peptides.

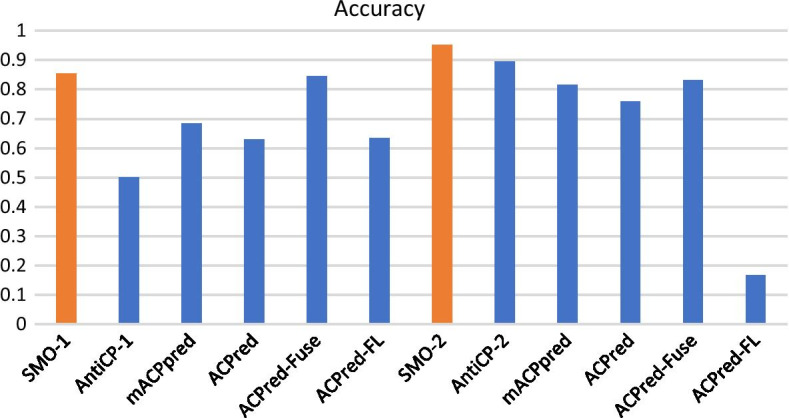
Results: This study chooses amino acid composition, N5C5, k-space, position-specific scoring matrix (PSSM) as features, and analyzes them by machine learning methods, including support vector machine (SVM) and sequential minimal optimization (SMO) to build a model (model 2) for distinguishing ACPs from whole peptides. Another model (model 1) that distinguishes ACPs from AMPs is also developed. Comparing to previous models, models developed in this research show better performance (accuracy: 85.5% for model 1 and 95.2% for model 2).

Conclusions: This work utilizes a new feature, PSSM, which contributes to better performance than other features. In addition to SVM, SMO is used in this research for optimizing SVM and the SMO-optimized models show better performance than non-optimized models. Last but not least, this work provides two different functions, including distinguishing ACPs from AMPs and distinguishing ACPs from all peptides. The second SMO-optimized model, which utilizes PSSM as a feature, performs better than all other existing tools.

Keywords: Anticancer peptides; PSSM; SMO; SVM.


Conflict of interest statement

The authors declare that they have no competing interests.

Figures

Fig. 1
Fig. 1
AAC analysis of positive, negative 1, negative 2. The frequency percentage of each amino acid in positive, negative1 and negative 2 data groups is shown in blue, orange and gray respectively
Fig. 2
Fig. 2
N5C5 analysis results. The three heatmaps on the left show frequency of each amino acid at each position in three different data groups, including positive, negative 1 and negative 2 data. The two heatmaps on the right show different values of each amino acid at each position comparing positive to negative 1 and negative 2 separately
Fig. 3
Fig. 3
10 most different k-space pairs comparing positive to negative 1, positive to negative 2. Blue bars on the left represent the percentage of the top 10 different k-space pairs comparing positive data to negative 1 data: KXXXK, KXL, KXXK, LXK, LXXXXK, AK, KK, LXXXXXK, AXXXXK, KXXXXL. Orange bars on the right show percentage of the ten most different k-space pairs in comparison with the positive data and negative 2 data: KXXXK, LXK, KXL, LXXXXK, KXXK, LXXXXXK, LXXXL, KXA, AK, KXXXXA
Fig. 4
Fig. 4
Accuracy comparison of SMO-1 (highlighted in orange), SMO-2 (highlighted in orange) and mACPpred, ACPred, ACPred-Fuse and ACPred-FL
Fig. 5
Fig. 5
Flowchart of this work. Four major steps are involved: data preparation, feature investigation, model construction and evaluation, and comparison with existing tools. In the first step, data preparation, two datasets are constructed, which are then separated into training and testing data after CD-HIT. Then four features are investigated: amino acid composition, N5C5, k-space and position-specific scoring matrix. The third step involves model learning, cross-validation, parameter optimization and evaluation. Finally, two models proposed are compared with other existing tools
Fig. 6
Fig. 6
ROC curve for training models using SVM

References

    1. Bray F, Ferlay J, Soerjomataram I, Siegel RL, Torre LA, Jemal A. Global cancer statistics 2018: GLOBOCAN estimates of incidence and mortality worldwide for 36 cancers in 185 countries. CA Cancer J Clin. 2018;68(6):394–424. doi: 10.3322/caac.21492. - DOI - PubMed
    1. Palumbo MO, Kavan P, Miller WH, Jr, Panasci L, Assouline S, Johnson N, Cohen V, Patenaude F, Pollak M, Jagoe RT, et al. Systemic cancer therapy: achievements and challenges that lie ahead. Front Pharmacol. 2013;4:57. doi: 10.3389/fphar.2013.00057. - DOI - PMC - PubMed
    1. Gatti L, Zunino F. Overview of tumor cell chemoresistance mechanisms. Methods Mol Med. 2005;111:127–148. - PubMed
    1. Gaspar D, Veiga AS, Castanho MA. From antimicrobial to anticancer peptides. A review. Front Microbiol. 2013;4:294. doi: 10.3389/fmicb.2013.00294. - DOI - PMC - PubMed
    1. Chung CR, Jhong JH, Wang Z, Chen S, Wan Y, Horng JT, Lee TY. Characterization and identification of natural antimicrobial peptides on different organisms. Int J Mol Sci. 2020;21(3):1–26. doi: 10.3390/ijms21030986. - DOI - PMC - PubMed