. 2021 May 29;22(1):164.
doi: 10.1186/s12931-021-01755-3.

Dysregulation of COVID-19 related gene expression in the COPD lung

Collaborators, Affiliations

Dysregulation of COVID-19 related gene expression in the COPD lung

Alastair Watson et al. Respir Res. .

Abstract

Background: Chronic obstructive pulmonary disease (COPD) patients are at increased risk of poor outcome from Coronavirus disease (COVID-19). Early data suggest elevated Severe Acute Respiratory Syndrome Coronavirus 2 (SARS-CoV-2) receptor angiotensin converting enzyme 2 (ACE2) expression, but relationships to disease phenotype and downstream regulators of inflammation in the Renin-Angiotensin system (RAS) are unknown. We aimed to determine the relationship between RAS gene expression relevant to SARS-CoV-2 infection in the lung with disease characteristics in COPD, and the regulation of newly identified SARS-CoV-2 receptors and spike-cleaving proteases, important for SARS-CoV-2 infection.

Methods: We quantified gene expression using RNA sequencing of epithelial brushings and bronchial biopsies from 31 COPD and 37 control subjects.

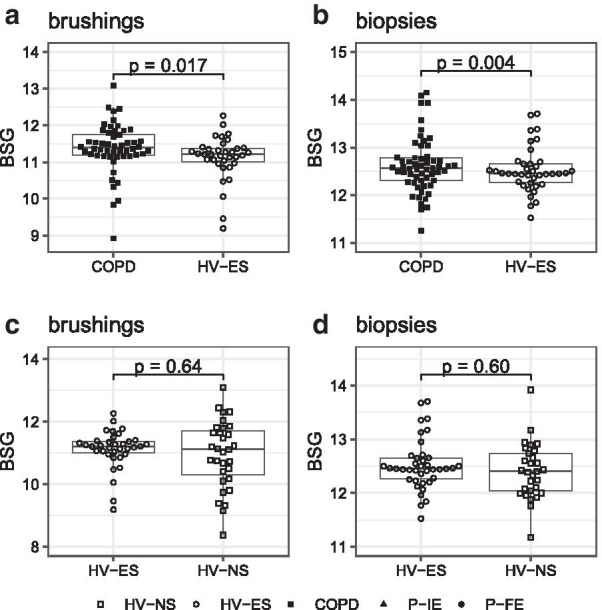
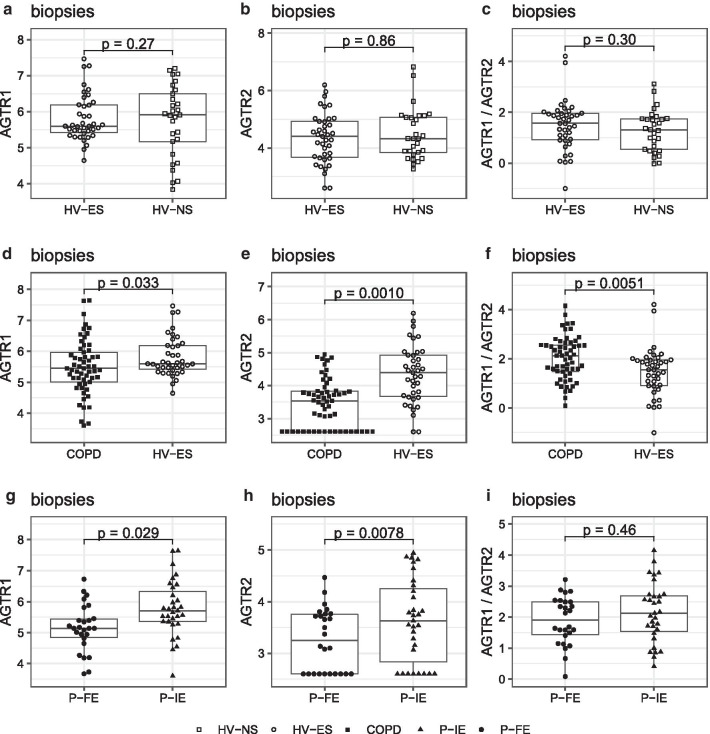
Results: ACE2 gene expression (log2-fold change (FC)) was increased in COPD compared to ex-smoking (HV-ES) controls in epithelial brushings (0.25, p = 0.042) and bronchial biopsies (0.23, p = 0.050), and correlated with worse lung function (r = - 0.28, p = 0.0090). ACE2 was further increased in frequent exacerbators compared to infrequent exacerbators (0.51, p = 0.00045) and associated with use of ACE inhibitors (ACEi) (0.50, p = 0.0034), having cardiovascular disease (0.23, p = 0.048) or hypertension (0.34, p = 0.0089), and inhaled corticosteroid use in COPD subjects in bronchial biopsies (0.33, p = 0.049). Angiotensin II receptor type (AGTR)1 and 2 expression was decreased in COPD bronchial biopsies compared to HV-ES controls with log2FC of -0.26 (p = 0.033) and - 0.40, (p = 0.0010), respectively. However, the AGTR1:2 ratio was increased in COPD subjects compared with HV-ES controls, log2FC of 0.57 (p = 0.0051). Basigin, a newly identified potential SARS-CoV-2 receptor was also upregulated in both brushes, log2FC of 0.17 (p = 0.0040), and bronchial biopsies, (log2FC of 0.18 (p = 0.017), in COPD vs HV-ES. Transmembrane protease, serine (TMPRSS)2 was not differentially regulated between control and COPD. However, various other spike-cleaving proteases were, including TMPRSS4 and Cathepsin B, in both epithelial brushes (log2FC of 0.25 (p = 0.0012) and log2FC of 0.56 (p = 5.49E-06), respectively) and bronchial biopsies (log2FC of 0.49 (p = 0.00021) and log2FC of 0.246 (p = 0.028), respectively).

Conclusion: This study identifies key differences in expression of genes related to susceptibility and aetiology of COVID-19 within the COPD lung. Further studies to understand the impact on clinical course of disease are now required.

Keywords: ACE2; COPD; COVID-19; Infection; Inflammation; SARS-CoV-2.


Conflict of interest statement

Dr. Öberg, Dr. Angermann, Dr. Hühn, Dr. Muthas, Dr. Etal, Dr Belfield, Dr. Karlsson, Dr. Nordström and Dr Ostridge are paid employees of AstraZeneca; Dr. Staples reports grants from AstraZeneca, during the conduct of the study; Dr. Wilkinson reports grants and personal fees from AstraZeneca, during the conduct of the study; personal fees and other from MMH, grants and personal fees from GSK, grants and personal fees from AZ, personal fees from BI, grants and personal fees from Synairgen, outside the submitted work; Dr Watson, Dr. Spalluto, Dr. Burke, Dr. Cellura and Dr. Freeman report no conflicts of interest.

Figures

Fig. 1
Fig. 1
Angiotensin-converting enzyme 2 (ACE2) expression in epithelial brushings (a, c, e, f, i) and bronchial biopsies(b, d, g, h, j). Gene expression is reported in vst. Each symbol represents a single sample, generally there are two samples per subject, symbol shapes indicate the different subject groups as shown in the legend at the bottom using the definitions in the main text. Boxes illustrate the median 25th and 75th percentile, whiskers extend to the smallest or largest value that is at most 1.5 times the interquartile range from the hinge. P-values represent the results of testing for differential expression using DeSeq2. ad, ij Blue lines represent the best fit of the relation between ACE2 and post bronchodilator lung function measurements, the grey shaded area represents the 95% confidence interval of the fit (eh)
Fig. 2
Fig. 2
Cluster of differentiation (CD)147 (basigin) expression in epithelial brushes (a, c) and bronchial biopsies (b, d) in COPD vs HV-ES (a, b) and HV-ES vs HV-NS (c, d). Gene expression is reported in vst, which corrects for sequencing depth and applies a variance stabilizing transformation [42]. The interpretation of graphical elements is the same as in Fig. 1.  P-values represent the results of testing for differential expression using DeSeq2
Fig. 3
Fig. 3
AGTR1 (a, d, g) and AGTR2 (b, e, h) expression in bronchial biopsies and the AGTR1/AGTR2 ratio (c, f, i), compared between HV-ES and HV-NS (a, b, c), COPD and HV-ES (d, e, f) and P-FE and P-IE (g, h, i). Gene expression is reported in vst, which corrects for sequencing depth and applies a variance stabilizing transformation [42]. The interpretation of graphical elements is the same as in Fig. 1. P-values represent the results of testing for differential expression using DeSeq2. c, f, i AGTR1/AGTR2 ratios are approximated by the difference between vst AGTR1 and AGTR2 expression
Fig. 4
Fig. 4
MAS1 proto-oncogene (MAS1) expression in epithelial brushes (a, c) and bronchial biopsies (b and d), comparing HV-ES and HV-NS (a, b) and COPD and HV-ES (c, d). Gene expression is reported in vst. The interpretation of graphical elements is the same as in Fig. 1. P-values represent the results of testing for differential expression using DeSeq2
Fig. 5
Fig. 5
Transmembrane protease, serine 2 (TMPRSS2) (a, b) and 4 (TMPRSS4) (c-f) expression in bronchial biopsies (b, d, f) and epithelial brushings (a, c, e). Gene expression is reported in vst. The interpretation of graphical elements is the same as in Fig. 1. P-values represent the results of testing for differential expression using DeSeq2

References

    1. Guan W-J, Liang W-H, Zhao Y, Liang H-R, Chen Z-S, Li Y-M, et al. Comorbidity and its impact on 1590 patients with Covid-19 in China: a nationwide analysis. Eur Respir J. 2020;1:2000547. doi: 10.1183/13993003.00547-2020. - DOI - PMC - PubMed
    1. Guan W-J, Ni Z-Y, Hu Y, Liang W-H, Ou C-Q, He J-X, et al. Clinical characteristics of coronavirus disease 2019 in China. N Engl J Med. 2020;382(18):1708–20. doi: 10.1056/NEJMoa2002032. - DOI - PMC - PubMed
    1. Avdeev SN, Yaroshetskiy AI, Tsareva NA, Merzhoeva ZM, Trushenko NV, Nekludova GV, et al. Noninvasive ventilation for acute hypoxemic respiratory failure in patients with COVID-19. Am J Emerg Med. 2021;39:154–157. doi: 10.1016/j.ajem.2020.09.075. - DOI - PMC - PubMed
    1. Burke H, Freeman A, O’Regan P, Wysocki O, Freitas A, Dushianthan A, et al. Dynamic Time Warping Analysis reveals novel prognostic biomarkers in Hospitalised COVID-19. Submitted to BMJ Open. - PMC - PubMed
    1. Docherty AB, Harrison EM, Green CA, Hardwick HE, Pius R, Norman L, et al. Features of 20 133 UK patients in hospital with covid-19 using the ISARIC WHO Clinical Characterisation Protocol: prospective observational cohort study. BMJ. 2020;369:m1985. doi: 10.1136/bmj.m1985. - DOI - PMC - PubMed

MeSH terms