

Brain network reorganization after targeted attack at a hub region
- PMID: 34052466
- PMCID: PMC8289586
- DOI: 10.1016/j.neuroimage.2021.118219
Brain network reorganization after targeted attack at a hub region
Abstract
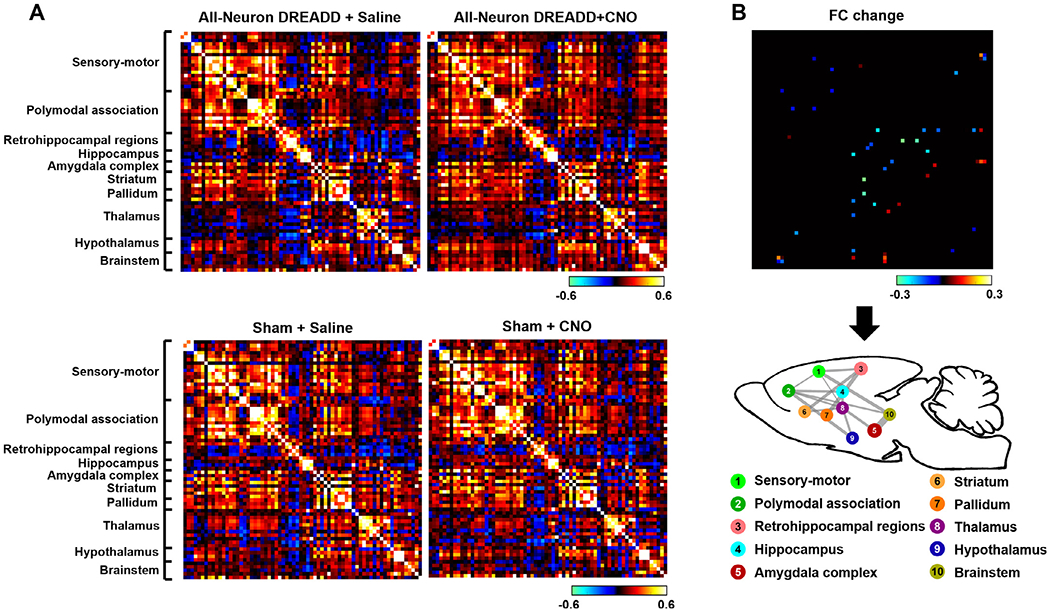
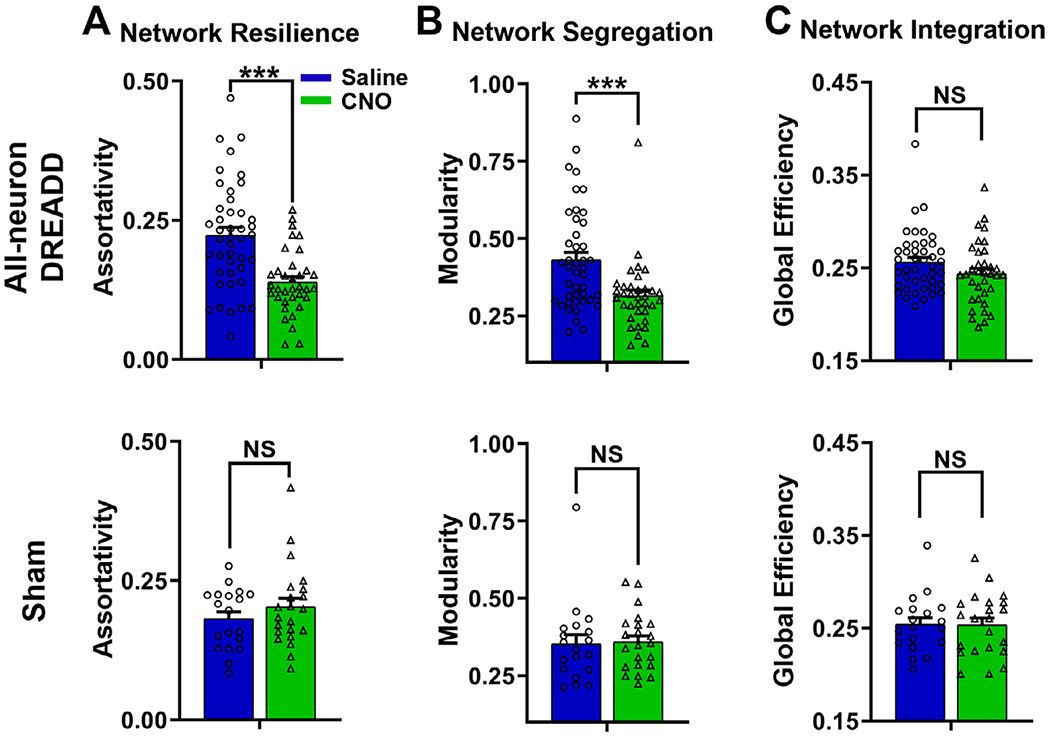
The architecture of brain networks has been extensively studied in multiple species. However, exactly how the brain network reconfigures when a local region, particularly a hub region, stops functioning remains elusive. By combining chemogenetics and resting-state functional magnetic resonance imaging (rsfMRI) in an awake rodent model, we investigated the causal impact of acutely inactivating a hub region (i.e. the dorsal anterior cingulate cortex) on brain network properties. We found that suppressing neural activity in a hub could have a ripple effect that went beyond the hub-related connections and propagated to other neural connections across multiple brain systems. In addition, hub dysfunction affected the topological architecture of the whole-brain network in terms of the network resilience and segregation. Selectively inhibiting excitatory neurons in the hub further changed network integration. None of these changes were observed in sham rats or when a non-hub region (i.e. the primary visual cortex) was perturbed. This study has established a system that allows for mechanistically dissecting the relationship between local regions and brain network properties. Our data provide direct evidence supporting the hypothesis that acute dysfunction of a brain hub can cause large-scale network changes. These results also provide a comprehensive framework documenting the differential impact of hub versus non-hub nodes on network dynamics.
Keywords: Awake; DREADD; Graph theory; Rat; Resting-state fMRI.
Copyright © 2021. Published by Elsevier Inc.
Conflict of interest statement
Declaration of Competing Interest The Authors declare no competing interests.
Figures


Similar articles
-
Suppressing Anterior Cingulate Cortex Modulates Default Mode Network and Behavior in Awake Rats.Cereb Cortex. 2021 Jan 1;31(1):312-323. doi: 10.1093/cercor/bhaa227. Cereb Cortex. 2021. PMID: 32820327 Free PMC article.
-
SPARK: Sparsity-based analysis of reliable k-hubness and overlapping network structure in brain functional connectivity.Neuroimage. 2016 Jul 1;134:434-449. doi: 10.1016/j.neuroimage.2016.03.049. Epub 2016 Apr 2. Neuroimage. 2016. PMID: 27046111
-
Functional connectivity hubs of the mouse brain.Neuroimage. 2015 Jul 15;115:281-91. doi: 10.1016/j.neuroimage.2015.04.033. Epub 2015 Apr 23. Neuroimage. 2015. PMID: 25913701
-
Functional networks and network perturbations in rodents.Neuroimage. 2017 Dec;163:419-436. doi: 10.1016/j.neuroimage.2017.09.038. Epub 2017 Sep 21. Neuroimage. 2017. PMID: 28942060 Review.
-
[Resting state functional MRI of the brain].Nervenarzt. 2014 Jun;85(6):690-700. doi: 10.1007/s00115-014-4013-y. Nervenarzt. 2014. PMID: 24849117 Review. German.
Cited by
-
Optogenetic stimulation of anterior insular cortex neurons in male rats reveals causal mechanisms underlying suppression of the default mode network by the salience network.Nat Commun. 2023 Feb 16;14(1):866. doi: 10.1038/s41467-023-36616-8. Nat Commun. 2023. PMID: 36797303 Free PMC article.
-
Applications in Awake Animal Magnetic Resonance Imaging.Front Neurosci. 2022 Apr 5;16:854377. doi: 10.3389/fnins.2022.854377. eCollection 2022. Front Neurosci. 2022. PMID: 35450017 Free PMC article. Review.
-
Investigating the relationships of structural and functional neural networks of primary visual cortex with engineered AAVs and chemogenetic-fMRI techniques.Theranostics. 2025 Mar 3;15(9):3821-3836. doi: 10.7150/thno.109625. eCollection 2025. Theranostics. 2025. PMID: 40213659 Free PMC article.
-
Sex differences in resting-state functional networks in awake rats.Res Sq [Preprint]. 2023 Mar 16:rs.3.rs-2684325. doi: 10.21203/rs.3.rs-2684325/v1. Res Sq. 2023. Update in: Brain Struct Funct. 2023 Jul;228(6):1411-1423. doi: 10.1007/s00429-023-02657-4. PMID: 36993730 Free PMC article. Updated. Preprint.
-
Dynamic and Functional Alterations of Neuronal Networks In Vitro upon Physical Damage: A Proof of Concept.Micromachines (Basel). 2022 Dec 19;13(12):2259. doi: 10.3390/mi13122259. Micromachines (Basel). 2022. PMID: 36557557 Free PMC article.
References
-
- Adam R, Johnston K, Menon RS, Everling S, 2020. Functional reorganization during the recovery of contralesional target selection deficits after prefrontal cortex lesions in macaque monkeys. Neuroimage 207, 116339. - PubMed
-
- Bassett DS, Bullmore E, 2006. Small-world brain networks. Neuroscientist 12, 512–523. - PubMed
Publication types
MeSH terms
Grants and funding
LinkOut - more resources
Full Text Sources
Other Literature Sources
Medical
