. 2021 May 29;12(6):558.
doi: 10.1038/s41419-021-03828-z.

Inhibition of the mTOR pathway and reprogramming of protein synthesis by MDM4 reduce ovarian cancer metastatic properties

Affiliations

Inhibition of the mTOR pathway and reprogramming of protein synthesis by MDM4 reduce ovarian cancer metastatic properties

Rossella Lucà et al. Cell Death Dis. .

Abstract

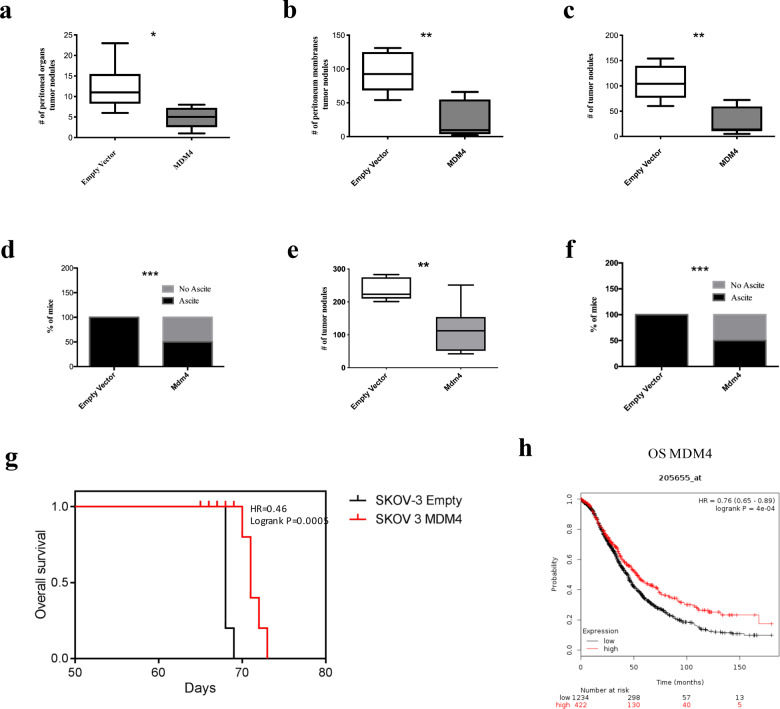
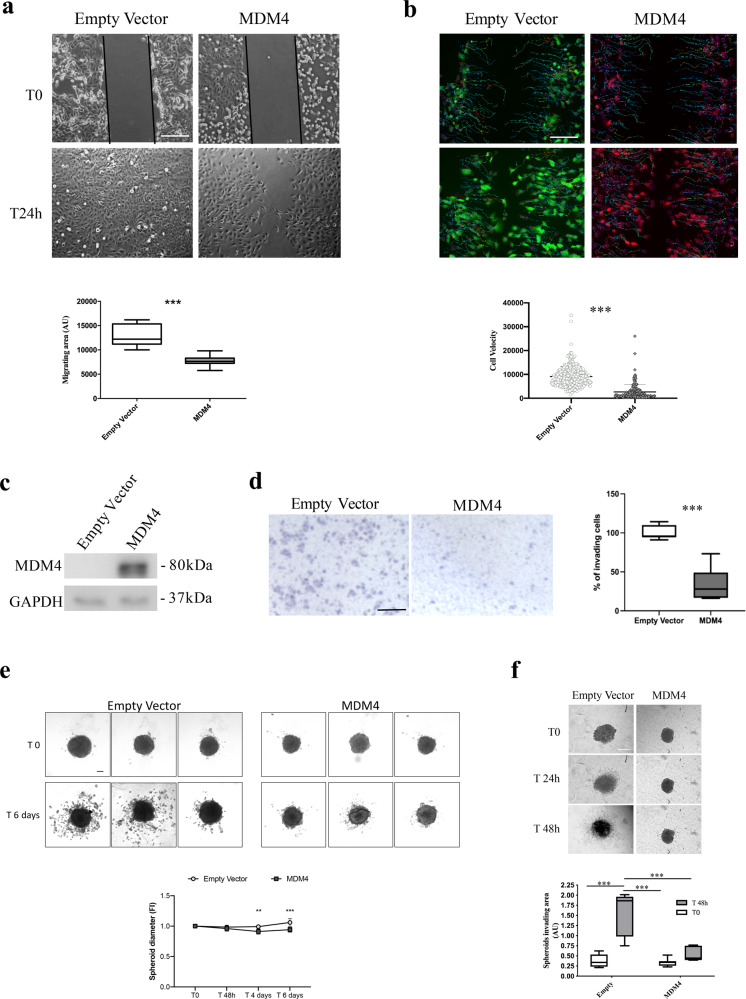
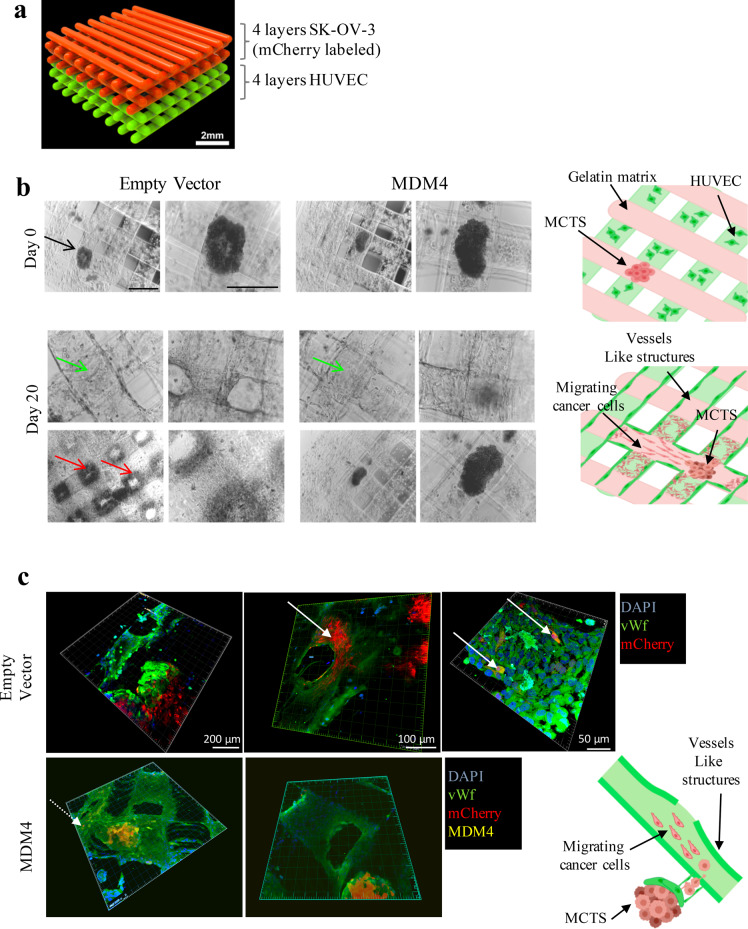
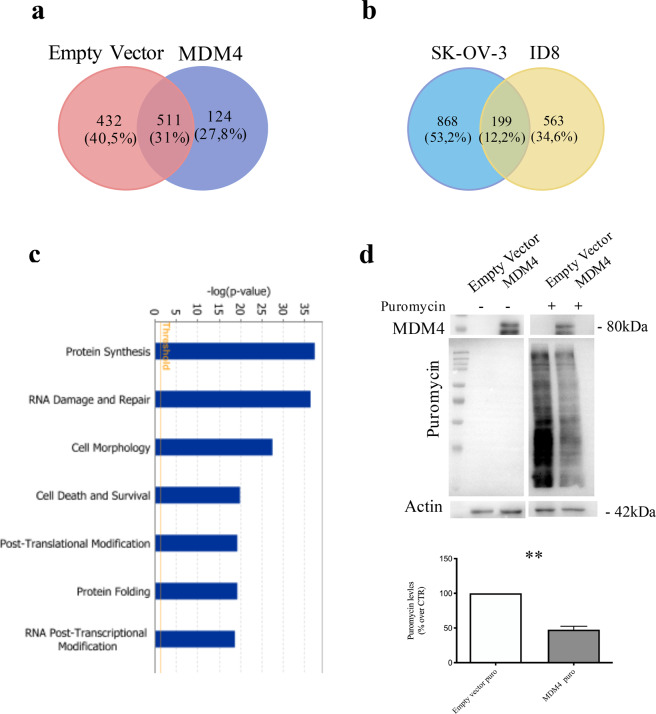
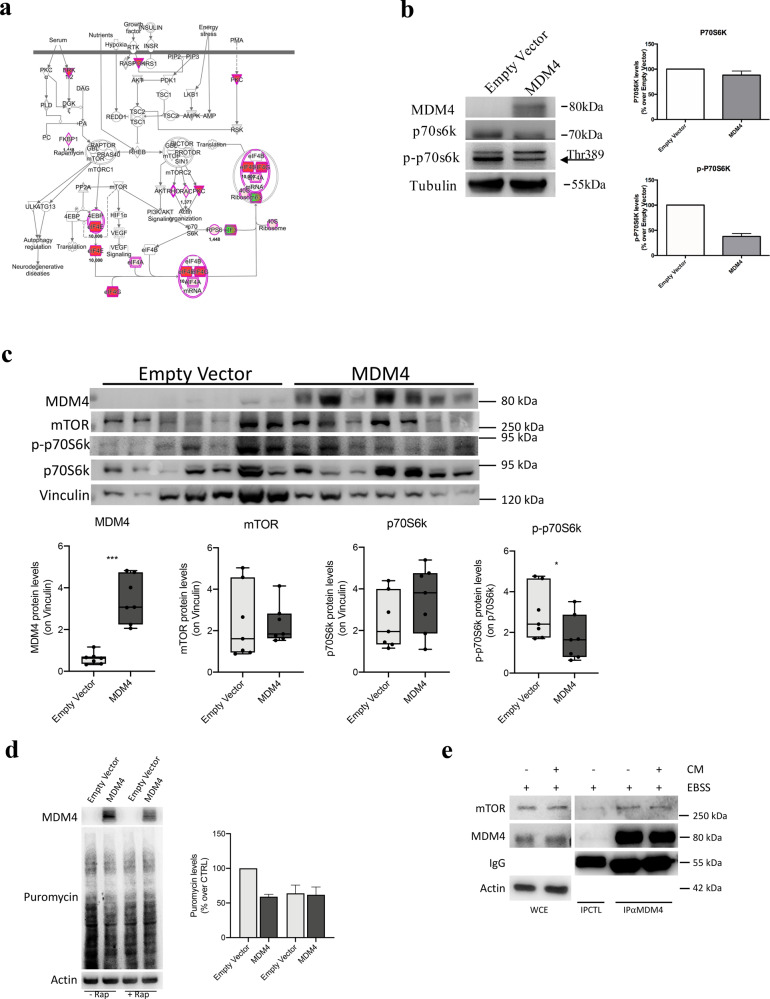
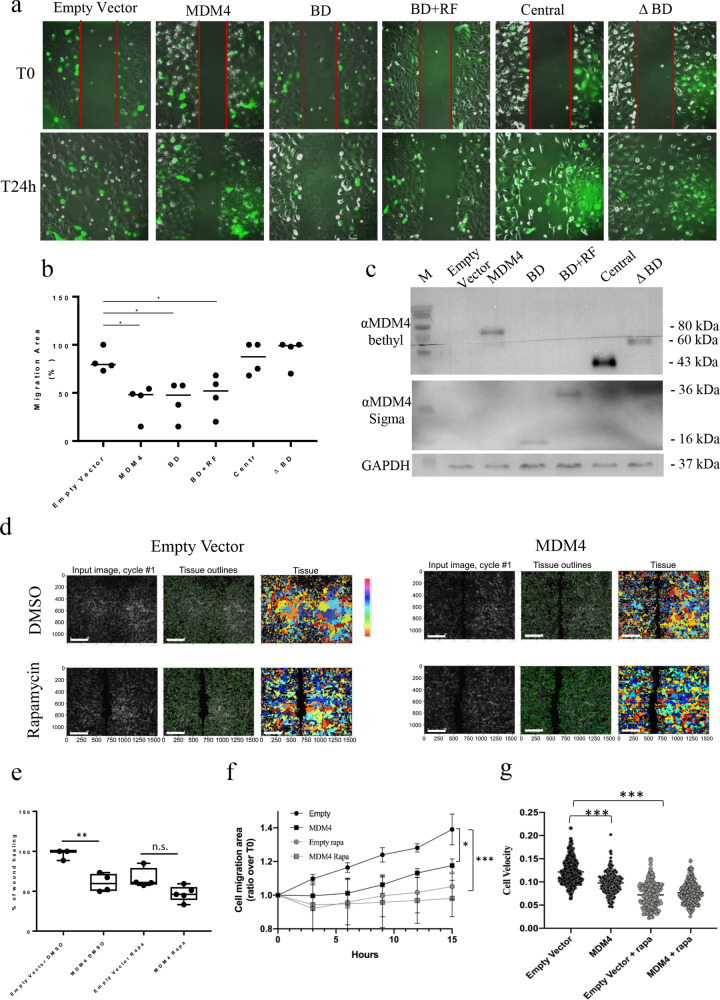
Epithelial ovarian cancer (EOC) is a highly heterogeneous disease with a high death rate mainly due to the metastatic spread. The expression of MDM4, a well-known p53-inhibitor, is positively associated with chemotherapy response and overall survival (OS) in EOC. However, the basis of this association remains elusive. We show that in vivo MDM4 reduces intraperitoneal dissemination of EOC cells, independently of p53 and an immune-competent background. By 2D and 3D assays, MDM4 impairs the early steps of the metastatic process. A 3D-bioprinting system, ad hoc developed by co-culturing EOC spheroids and endothelial cells, showed reduced dissemination and intravasation into vessel-like structures of MDM4-expressing cells. Consistent with these data, high MDM4 levels protect mice from ovarian cancer-related death and, importantly, correlate with increased 15 y OS probability in large data set analysis of 1656 patients. Proteomic analysis of EOC 3D-spheroids revealed decreased protein synthesis and mTOR signaling, upon MDM4 expression. Accordingly, MDM4 does not further inhibit cell migration when its activity towards mTOR is blocked by genetic or pharmacological approaches. Importantly, high levels of MDM4 reduced the efficacy of mTOR inhibitors in constraining cell migration. Overall, these data demonstrate that MDM4 impairs EOC metastatic process by inhibiting mTOR activity and suggest the usefulness of MDM4 assessment for the tailored application of mTOR-targeted therapy.


Conflict of interest statement

The authors declare no competing interests.

Figures

Fig. 1
Fig. 1. MDM4 decreases ovarian cancer nodules dissemination and improves EOC patients’ overall survival probability.
a Number of nodules in peritoneal organs of Empty Vector or MDM4-SK-OV-3-injected mice (n = 6, two-tailed Student’s t test, p = 0.018). b Number of peritoneum membranes nodules as in c (n = 6, two-tailed Student’s t test, p = 0.0016). c Total number of nodules present in both peritoneal organs and peritoneum membranes (n = 6, two-tailed Student’s t test, p = 0.0016). d Percentage of mice showing ascites at the final time point (n = 6, χ2 test, p < 0.0001). e Total number of nodules in Empty Vector or Mdm4-ID8 cells (n = 6 for Empty Vector, n = 7 for Mdm4, two-tailed Student’s t test, p = 0.0042). Nodules were counted blindly by two independent observers. f ID8 ascites analysis as in d (n = 15, χ2 test p < 0.0001). g OS in mice injected with Empty Vector or MDM4-SK-OV-3 cells (n = 5, log-rank test, p < 0.001). h Correlation of MDM4 expression with OS in 1656 patients with epithelial ovarian cancer followed for 15 years (log-rank test, p = 0.0004).
Fig. 2
Fig. 2. Cell migration and invasion are impaired by high levels of MDM4.
a Migration of Empty Vector and MDM4-SK-OV-3 cells evaluated through wound-healing assay. Pictures were taken at time 0 and 24 h after the scratch. Pictures are representative of four biological replicates (n = 4, two-tailed Student’s t test p < 0.0001); scale bar = 200 μM. b Representative time-lapse micrographs of cell velocity of a mixed population of Empty Vector and MDM4-SK-OV-3 cells labeled with GFP or mCherry, respectively, in a wound-healing migration assay (n = 331 cells for Empty Vector and n = 177 cells for MDM4, two-tailed Student’s t test, p < 0,0001); scale bar = 200 μM. c Representative WB of MDM4 levels following overexpression in OVCAR-3 cells. d Micrographs of transwell cell invasion assay through matrigel by Empty Vector or MDM4- OVCAR-3 cells scale bar = 50 μM. Right panel shows the quantification (mean ± SD, n = 3, two-tailed Student’s t test, p < 0.0001). e Representative images of invading Empty Vector- or MDM4-SK-OV-3 multicellular tumor spheroids (MCTSs) at time 0 and after 6 days of culture. Lower panel, spheroid diameter extrapolated by spheroid area calculated by Visual ImageJ and correlated to t0 area set to 1 (n = 7, two-tailed Student t test, **p = 0.0041 ***p < 0.0001). f Representative time-lapse images of invading Empty Vector- or MDM4-SK-OV-3 MCTSs. The invading area was calculated as follows: total MCTS area at 48 h minus MCTS body area at t0 (n = 5, Two-way ANOVA for multiple comparisons, p = 0.001); scale bar = 100 μM.
Fig. 3
Fig. 3. Cell spreading is impaired by MDM4 in a 3D-bioprinting assay.
a Rendering of the 3D-bioprinting geometry used. b Representative pictures of bioprinted constructs carrying MCTS and HUVEC at day 0 (upper panels, black arrow points to the MCTS) and day 20 after bioprinting (lower panels); red and green arrows point to cancer cells spreading and to vessels-like structures, respectively. Right panels show the rendering of day 0 bioprinting strategy (upper panel) and cell invasion at day 20 (lower panel); scale bars = 200 mM. c Confocal microscopy of constructs showing the vessels-like structures (stained with sheep anti-Von Willebrand Factor AbCam Cat# ab11713, green signal), cancer cells expressing mCherry (red signal), and MDM4 (stained with Mouse anti-MDM4 Ab OriGene Cat# TA505706, yellow signal), DAPI stains nuclei. White arrows point to migrating cancer cells. The drawing shows the rendering of cancer cells escaping from the MCTS and entering vessels-like structures.
Fig. 4
Fig. 4. MDM4 overexpression leads to a decreased generalized protein translation.
a Venn diagram showing the overlap of protein expressed in Empty Vector- and MDM4-SK-OV-3 cells. b Venn diagram showing common proteins between SK-OV-3 and ID8 cells overexpressing MDM4. c IPA biofunctional analysis of the proteins differently expressed in MDM4-SK-OV-3 cells compared to Empty Vector. d SunSet assay of Empty Vector- and MDM4-SK-OV-3 cells; representative WB analysis of indicated proteins following indicated treatments (upper panel), quantification of three independent assays (lower panel) (n = 3, one-sample t test p = 0.009).
Fig. 5
Fig. 5. MDM4 expression affects mTOR activation.
a Pathway analysis of mTOR signaling in SK-OV-3 cells. Red and green colors underlie proteins differently expressed in MDM4- compared with Empty vector-SK-OV-3 cells (red = upregulated, green = downregulated proteins). b WB of Empty Vector or MDM4-SK-OV-3 cells showing S6K1 and p70S6K1T389 expression (left panel) and quantification (right panel) (n = 3, one-sample t test p < 0.001). c WB of indicated proteins in tumor nodules (one per mouse) generated by IP injection of Empty Vector or MDM4-SK-OV-3 cells in mice; lower panels show quantification (n = 7 mice, two-sided Student’s t test, ***p < 0.001, *p = 0.048). d SunSet assay of Empty Vector- and MDM4-SK-OV-3 cells treated with rapamycin for 6 hours; quantification of two independent assays (right panel). e WB of indicated proteins in whole-cell extract (WCE) and co-immunocomplex from SK-OV-3 cells grown in EBSS for 1 hour and then in absence or presence of complete medium for additional 1 hour (CM). 1 mg of WCE was immunoprecipitated with anti-MDM4 antibody (IPαMDM4) or control Ig (IPCTL). Right panel shows the analysis of 1/100 of WCE.
Fig. 6
Fig. 6. mTOR is required for MDM4 activity on cell migration.
a Upper panel: representative pictures of cell migration evaluated through wound-healing assay of Empty Vector- or SK-OV-3 cells expressing wt or MDM4 deletion mutants+GFP as indicated. Pictures were taken at time 0 and 24 h after the scratch. Scale bar = 200 Mμ b quantification of cell migration (n = 4, one-way ANOVA for multiple comparisons, Empty vector vs wt-MDM4, p = 0.0135; Empty vector vs BD, p = 0.015; Empty vector vs BD + RF, p = 0.04). BD = p53-binding domain, RF = Ring Finger domain, Central = Central domain- lacking both BD and RF domains. c WB of MDM4 deletion mutants used in a. d Representative images of cell migration of Empty Vector and MDM4-SK-OV-3 cells using Rapamycin (Rapa) or vehicle (DMSO). Representative micrographs show the analysis performed with Cell Profiler 3.1.9, 15 h after scratching. Colors are randomly assigned by the software. e Quantification of cell migration shown in c using Fiji (n = 4, one-way ANOVA for multiple comparisons, Empty Vector+DMSO vs MDM4 + DMSO, p = 0.004; Empty Vector+DMSO vs Empty vector+Rapa, p = 0.01; Empty Vector+DMSO vs MDM4 + Rapa, p = 0.0002). f Quantification of cell confluency shown in c (one-way ANOVA for multiple comparisons, Empty Vector+DMSO vs MDM4 + DMSO, p = 0.04; Empty Vector+DMSO vs Empty vector+Rapa, p = 0.001; Empty Vector+DMSO vs MDM4 + Rapa, p = 0.0003). g Cell velocity analysis of cell migration shown in c (n = 392 cells for Empty Vector+DMSO, n = 229 cells for MDM4 + DMSO, n = 170 cells for Empty Vector+Rapa, n = 232 for MDM4 + Rapa, one-way ANOVA for multiple comparisons, Empty Vector+DMSO vs MDM4 + DMSO, p < 0.0001; Empty Vector+DMSO vs Empty vector+Rapa, p < 0.0001).

Similar articles

Cited by

References

    1. Torre LA, et al. Ovarian cancer statistics, 2018. CA Cancer J. Clin. 2018;68:284–296. doi: 10.3322/caac.21456. - DOI - PMC - PubMed
    1. Lheureux S, Gourley C, Vergote I, Oza AM. Epithelial ovarian cancer. Lancet. 2019;393:1240–1253. doi: 10.1016/S0140-6736(18)32552-2. - DOI - PubMed
    1. Karnezis AN, Cho KR, Gilks CB, Pearce CL, Huntsman DG. The disparate origins of ovarian cancers: pathogenesis and prevention strategies. Nat. Rev. Cancer. 2017;17:65–74. doi: 10.1038/nrc.2016.113. - DOI - PubMed
    1. Coffman LG, et al. New models of hematogenous ovarian cancer metastasis demonstrate preferential spread to the ovary and a requirement for the ovary for abdominal dissemination. Transl. Res. 2016;175:92–102.e2. doi: 10.1016/j.trsl.2016.03.016. - DOI - PMC - PubMed
    1. Pradeep S, et al. Hematogenous metastasis of ovarian cancer: rethinking mode of spread. Cancer Cell. 2014;26:77–91. doi: 10.1016/j.ccr.2014.05.002. - DOI - PMC - PubMed

Publication types