

Real-time nowcasting and forecasting of COVID-19 dynamics in England: the first wave
- PMID: 34053254
- PMCID: PMC8165585
- DOI: 10.1098/rstb.2020.0279
Real-time nowcasting and forecasting of COVID-19 dynamics in England: the first wave
Abstract
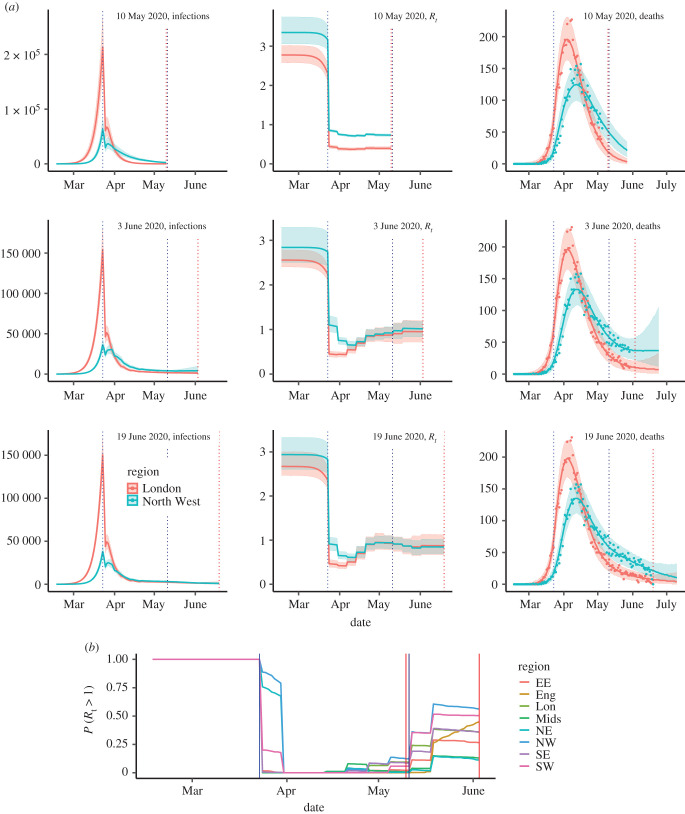
England has been heavily affected by the SARS-CoV-2 pandemic, with severe 'lockdown' mitigation measures now gradually being lifted. The real-time pandemic monitoring presented here has contributed to the evidence informing this pandemic management throughout the first wave. Estimates on the 10 May showed lockdown had reduced transmission by 75%, the reproduction number falling from 2.6 to 0.61. This regionally varying impact was largest in London with a reduction of 81% (95% credible interval: 77-84%). Reproduction numbers have since then slowly increased, and on 19 June the probability of the epidemic growing was greater than 5% in two regions, South West and London. By this date, an estimated 8% of the population had been infected, with a higher proportion in London (17%). The infection-to-fatality ratio is 1.1% (0.9-1.4%) overall but 17% (14-22%) among the over-75s. This ongoing work continues to be key to quantifying any widespread resurgence, should accrued immunity and effective contact tracing be insufficient to preclude a second wave. This article is part of the theme issue 'Modelling that shaped the early COVID-19 pandemic response in the UK'.
Keywords: Bayesian; COVID-19; dynamics; forecasting; nowcasting; real-time.
Figures
References
-
- Center for Systems Science and Engineering (CSSE), Johns Hopkins University. 2020 COVID-19 Case Tracker. See https://coronavirus.jhu.edu/map.html (accessed 25 June 2020).
-
- World Health Organization. 2020 WHO Director-General’s opening remarks at the media briefing on COVID-19 – 11 March 2020. See https://www.who.int/dg/speeches/detail/who-director-general-s-opening-re... (accessed 25 June 2020).
-
- UK Government. 2020 Precautionary SAGE meeting on Wuhan Coronavirus (WN-CoV). See https://assets.publishing.service.gov.uk/government/uploads/system/uploa... (accessed 9 July 2020).
Publication types
MeSH terms
Grants and funding
LinkOut - more resources
Full Text Sources
Other Literature Sources
Medical
Miscellaneous
