. 2021 Jul 19;376(1829):20200261.
doi: 10.1098/rstb.2020.0261. Epub 2021 May 31.

The impact of school reopening on the spread of COVID-19 in England

Affiliations

The impact of school reopening on the spread of COVID-19 in England

Matt J Keeling et al. Philos Trans R Soc Lond B Biol Sci. .

Abstract

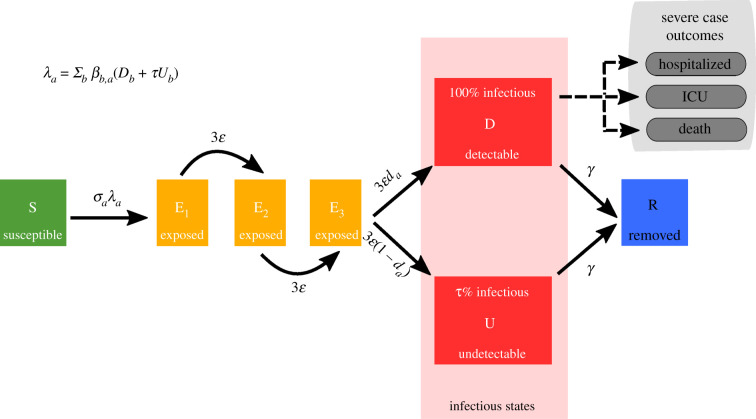
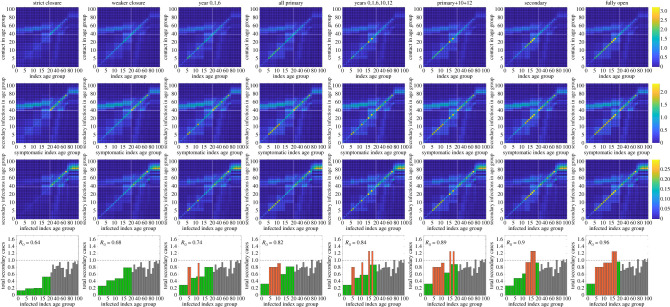
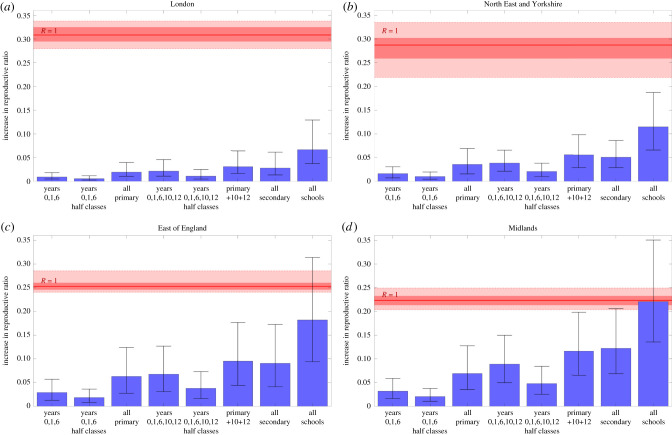
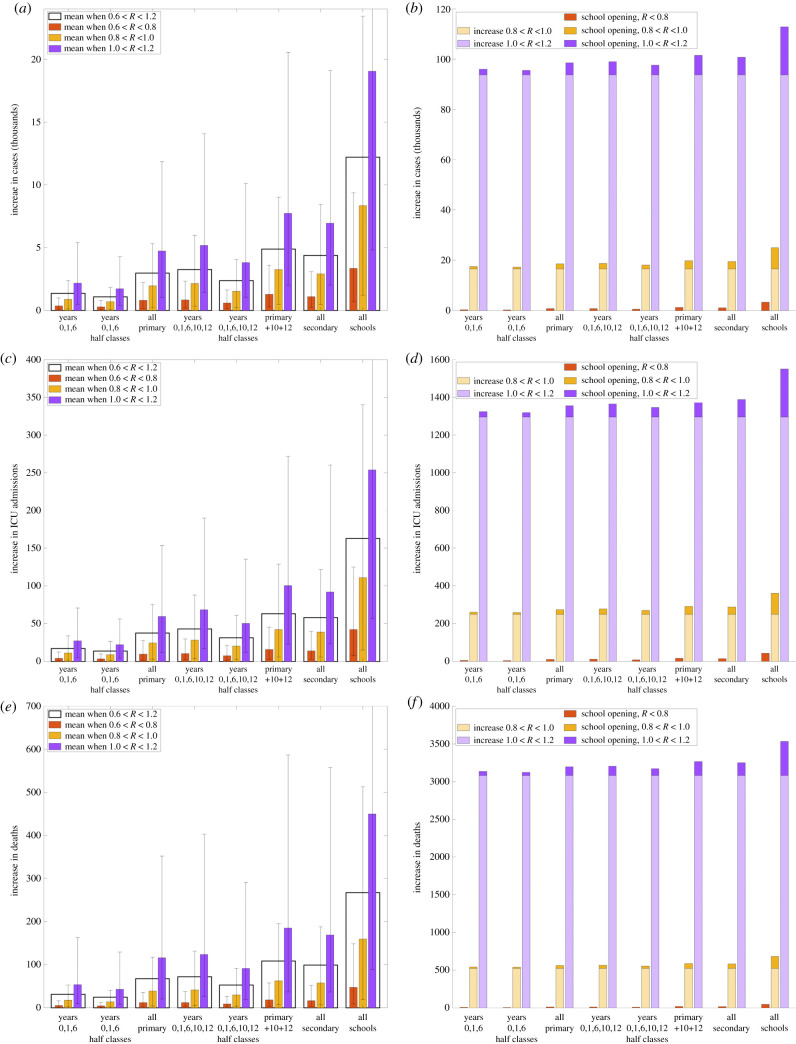
By mid-May 2020, cases of COVID-19 in the UK had been declining for over a month; a multi-phase emergence from lockdown was planned, including a scheduled partial reopening of schools on 1 June 2020. Although evidence suggests that children generally display mild symptoms, the size of the school-age population means the total impact of reopening schools is unclear. Here, we present work from mid-May 2020 that focused on the imminent opening of schools and consider what these results imply for future policy. We compared eight strategies for reopening primary and secondary schools in England. Modifying a transmission model fitted to UK SARS-CoV-2 data, we assessed how reopening schools affects contact patterns, anticipated secondary infections and the relative change in the reproduction number, R. We determined the associated public health impact and its sensitivity to changes in social distancing within the wider community. We predicted that reopening schools with half-sized classes or focused on younger children was unlikely to push R above one. Older children generally have more social contacts, so reopening secondary schools results in more cases than reopening primary schools, while reopening both could have pushed R above one in some regions. Reductions in community social distancing were found to outweigh and exacerbate any impacts of reopening. In particular, opening schools when the reproduction number R is already above one generates the largest increase in cases. Our work indicates that while any school reopening will result in increased mixing and infection amongst children and the wider population, reopening schools alone in June 2020 was unlikely to push R above one. Ultimately, reopening decisions are a difficult trade-off between epidemiological consequences and the emotional, educational and developmental needs of children. Into the future, there are difficult questions about what controls can be instigated such that schools can remain open if cases increase. This article is part of the theme issue 'Modelling that shaped the early COVID-19 pandemic response in the UK'.

Keywords: COVID-19; SARS-CoV-2; deterministic model; mathematical modelling; reopening schools.


Figures

Figure 1.
Figure 1.
Disease states and transitions. We stratified the population into susceptible, exposed, detectable infectious, undetectable infectious, and removed states. Solid lines correspond to disease state transitions, with dashed lines representing mapping from detectable cases to severe clinical cases that require hospital treatment, critical care (ICU), or result in death. We separated those aged between 0 and 19 years old into single years, with the remainder of the population stratified into five-year age brackets. See table 1 for a listing of model parameters. Note, we have not included quarantining or household status in this depiction of the system.
Figure 2.
Figure 2.
Mixing matrices and their implications for onwards transmission. We consider the effect on contact structures between different age groups under (first column) strict school closure, (second column) weak closure, (third column) years 0 (reception), 1 and 6 returning to school, (fourth column) all primary school children at school, (fifth column) years 0, 1, 6, 10 and 12 at school, (sixth column) all primary school children and years 10 and 12 at school, (seventh column) all secondary school children at school and (eighth column) all children in school. For each school closure, we show: (first row) the average number of contacts by age for each index age group [34]; (second row) the average number of secondary infections for a symptomatic infected individual by age (combining the mixing matrix with age-susceptibility); and (third row) the average number of secondary infections for each infected individual by age (combining the mixing matrix, age-susceptibility and the impact of asymptomatic transmission). (Fourth row) The total number of secondary infections for each infected index age group. Green bars indicate school year groups who remain at home, while red bars indicate year groups who return to school.
Figure 3.
Figure 3.
Increase in reproduction number/reproductive ratio, R, under eight school reopening scenarios for four regions in England. Estimates are depicted for the following four regions: (a) London (R ≈ 0.69), (b) North East and Yorkshire (R ≈ 0.71, (c) East of England (R ≈ 0.74), (d) the Midlands (R ≈ 0.78). For each scenario, bars represent the mean absolute increase in R, compared to what we would observe if schools remained closed. We also give the 95% prediction intervals. Solid red lines identify the absolute increase required to raise R above 1, within each region, alongside 50% and 95% intervals (shaded red areas). Means and intervals are calculated from 1000 replicates sampled from the posterior parameter distributions. All scenarios are implemented on 1 June 2020 and continued until 22 July 2020.
Figure 4.
Figure 4.
Increase in disease burden and clinical case outcomes from 1 June to 22 July 2020 under the eight different scenarios representing various combinations of school years' return to school. (a,b) Cases; (c,d) ICU admissions and (e,f ) deaths. For each scenario, the three coloured bars give the increase relative to if no schools returned for low (red), intermediate (yellow) and high (purple) reproduction numbers, while the clear bar (in panels a,c and e) is the mean across all reproduction numbers. Prediction intervals are given for each scenario representing the uncertainty in the predicted values. In panels b, d and f, we also display (in lighter colours) the increase in each quantity that is associated with the change in R from the current low situation.

Similar articles

Cited by

References

    1. Li LQ, Huang T, Wang YQ, Wang ZP, Liang Y, Huang TB, Zhang HY, Sun W, Wang Y. 2020. COVID-19 patients’ clinical characteristics, discharge rate, and fatality rate of meta-analysis. J. Med. Virol. 92, 577-583. (10.1002/jmv.25757) - DOI - PMC - PubMed
    1. Ludvigsson JF. 2020. Systematic review of COVID-19 in children shows milder cases and a better prognosis than adults. Acta Paediatrica, Int. J. Paediatr. 109, 1088-1095. (10.1111/apa.15270) - DOI - PMC - PubMed
    1. Forbes MB, Mehta K, Kumar K, Lu J, Le Saux N, Sampson M, Robinson J. 2020. COVID-19 infection in children: estimating pediatric morbidity and mortality. medRxiv (10.1101/2020.05.05.20091751) - DOI
    1. NHS England. 2020. COVID-19 total announced deaths 27 May 2020. https://www.england.nhs.uk/statistics/wp-content/uploads/sites/2/2020/05... [Online] (accessed 23 June 2020).
    1. Dong Y, Mo X, Hu Y, Qi X, Jiang F, Jiang Z, Tong S. 2020. Epidemiology of COVID-19 among children in China. Pediatrics 145, e20200702. (10.1542/peds.2020-0702) - DOI - PubMed

Publication types

LinkOut - more resources