. 2021 Jul 19;376(1829):20200275.
doi: 10.1098/rstb.2020.0275. Epub 2021 May 31.

Segmentation and shielding of the most vulnerable members of the population as elements of an exit strategy from COVID-19 lockdown

Affiliations

Segmentation and shielding of the most vulnerable members of the population as elements of an exit strategy from COVID-19 lockdown

Bram A D van Bunnik et al. Philos Trans R Soc Lond B Biol Sci. .

Abstract

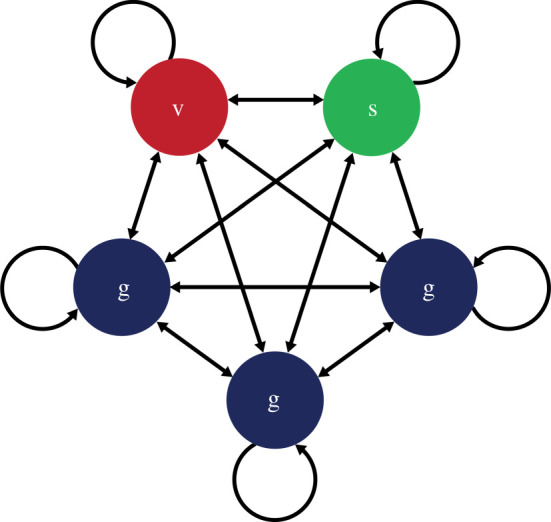
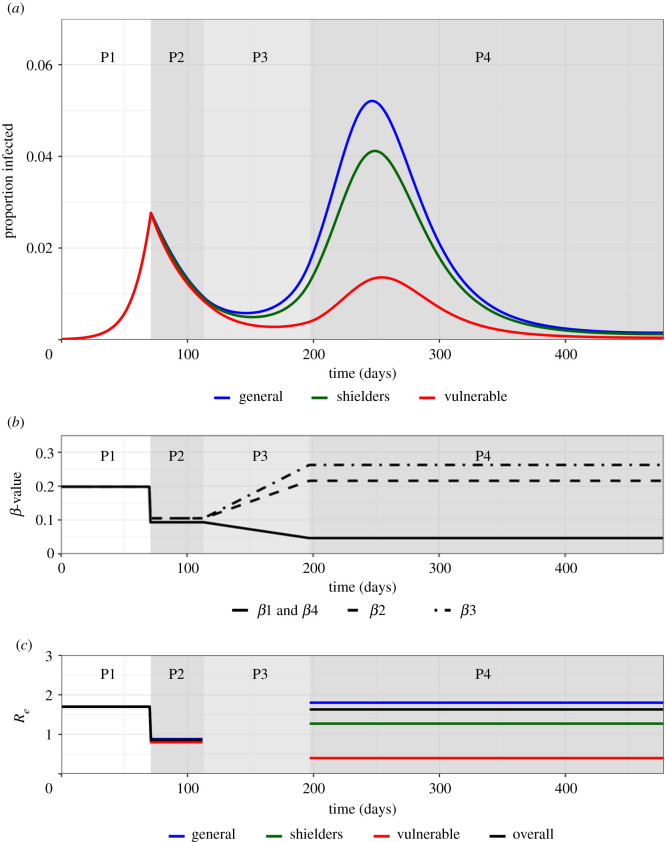
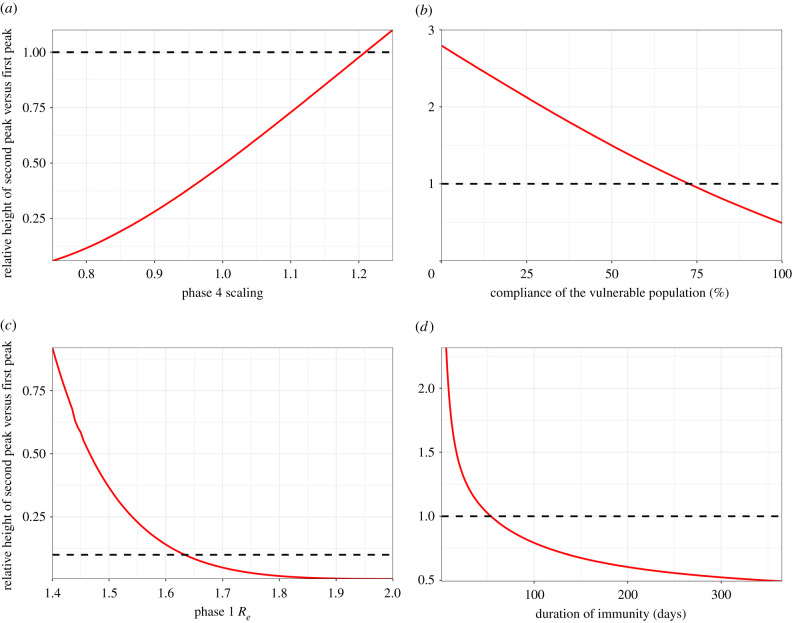
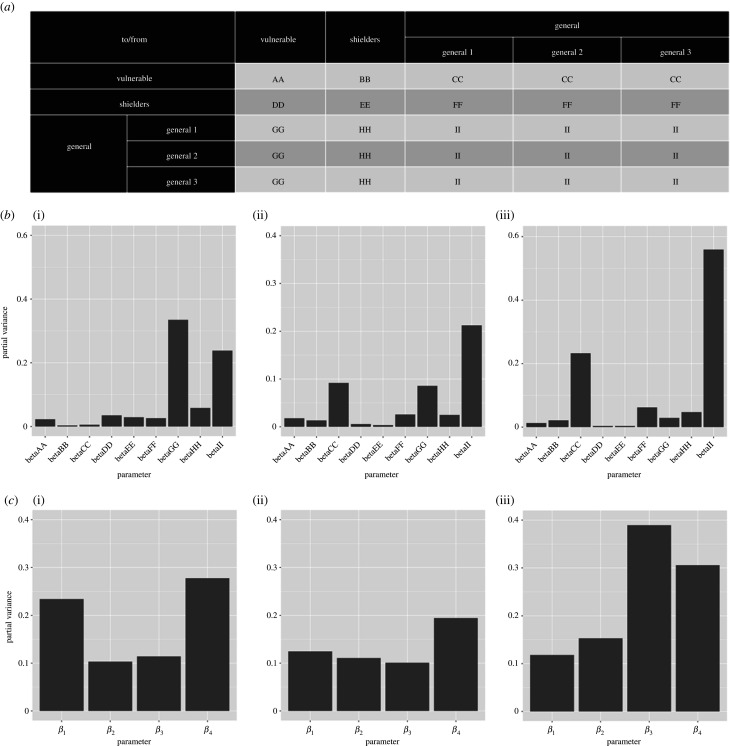
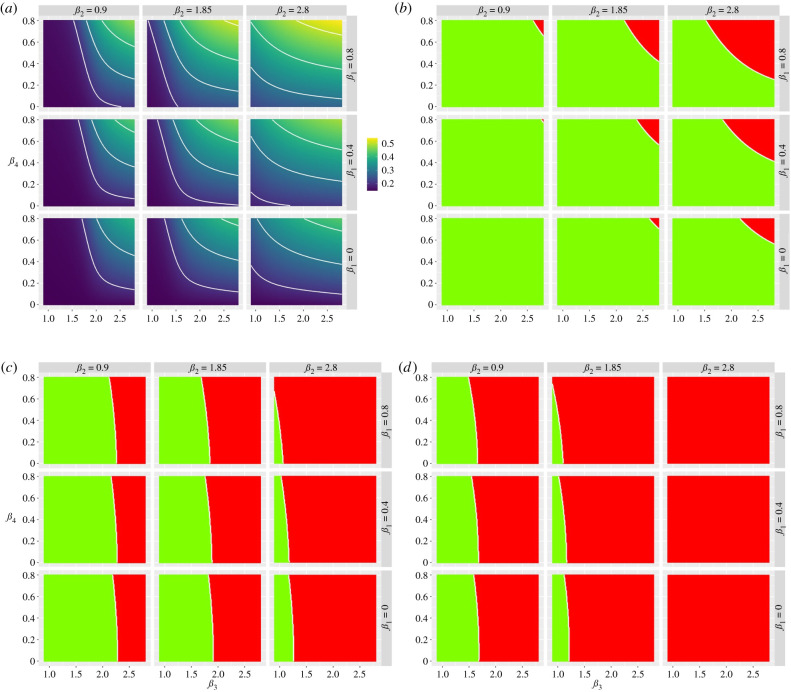
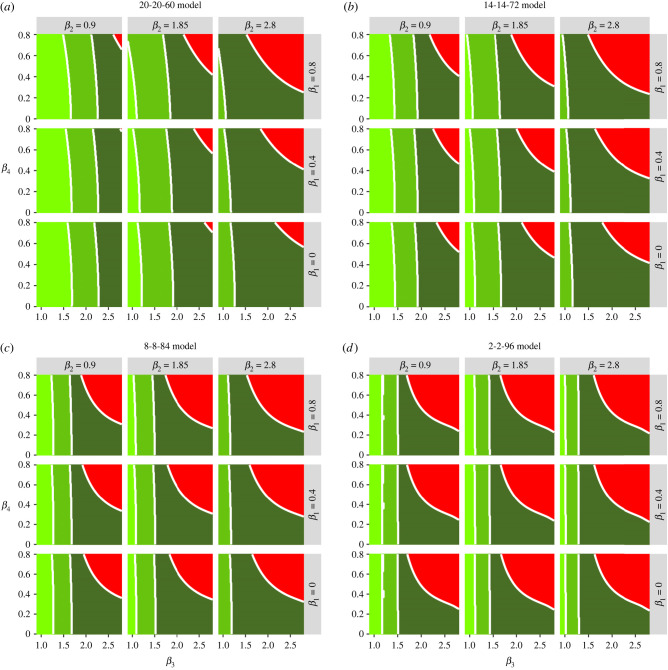
This study demonstrates that an adoption of a segmenting and shielding strategy could increase the scope to partially exit COVID-19 lockdown while limiting the risk of an overwhelming second wave of infection. We illustrate this using a mathematical model that segments the vulnerable population and their closest contacts, the 'shielders'. Effects of extending the duration of lockdown and faster or slower transition to post-lockdown conditions and, most importantly, the trade-off between increased protection of the vulnerable segment and fewer restrictions on the general population are explored. Our study shows that the most important determinants of outcome are: (i) post-lockdown transmission rates within the general and between the general and vulnerable segments; (ii) fractions of the population in the vulnerable and shielder segments; (iii) adherence to protective measures; and (iv) build-up of population immunity. Additionally, we found that effective measures in the shielder segment, e.g. intensive routine screening, allow further relaxations in the general population. We find that the outcome of any future policy is strongly influenced by the contact matrix between segments and the relationships between physical distancing measures and transmission rates. This strategy has potential applications for any infectious disease for which there are defined proportions of the population who cannot be treated or who are at risk of severe outcomes. This article is part of the theme issue 'Modelling that shaped the early COVID-19 pandemic response in the UK'.

Keywords: COVID-19; SARS-CoV-2; exit strategy; mathematical model; segmenting and shielding.


Figures

Figure 1.
Figure 1.
A contact structure for the 20-20-60 model. There are five segments, each comprising 20% of the total. v = vulnerable; s = shielders; g = general population. Transmission occurs within and between segments. Transmission rates within and between the three g segments are always homogeneous, but may vary within and between segments of different types. (Online version in colour.)
Figure 2.
Figure 2.
Trajectory plots for the proportion infected in the vulnerable, shielders and general populations, with accompanying β and Re plots for the baseline scenario. Phases 1–4 are indicated. (a) Trajectory plots of the proportion of those infected in the vulnerable (green), shielders (red) and general (blue) populations, shading depicts the different phases of enhanced shielding intervention. (b) Values for the different β over the course of the simulation as they are implemented for the different intervention phases. In short, β1: transmission among and between vulnerable and shielders; β2: transmission between shielders and general population; β3: transmission between general population; β4: transmission between vulnerable and general population (see table 1 for full WAIFW matrix). (c) Values of the corresponding Re values (colours) for the different subpopulations and the overall Re (black) during the different intervention phases. (See the electronic supplementary material, Information for calculation of overall Re). (Online version in colour.)
Figure 3.
Figure 3.
Sensitivity analyses. Plots show the relative height of the second peak versus the first peak Iv as a function of relevant parameter value. Dotted lines represent peaks of equal height. (a) Relative values of Re in P3/P4. The second peak is higher for a relative value greater than 1.22, corresponding to Re > 1.99. (b) Adherence in P3/P4. 100% adherence equates to P4 Rev=0.4 (baseline value); 0% adherence equates to a pre-lockdown value of Rev=1.7. The second peak is higher for adherence less than 74%. (c) Re in all phases. P1 Re values are shown; Re values in other phases are scaled accordingly. The second peak is higher for P1 Re < 1.63. (d) Duration of immunity (expressed as 1/ζ). The second peak is higher for 1/ζ < 54 days.
Figure 4.
Figure 4.
Results of a global sensitivity (FAST) analysis on three key outcome measures with regard to the proportion of the vulnerable population that become infected (Iv): (i) the height of the second peak of Iv; (ii) whether the second peak of Iv is higher than the first peak and (iii) cumulative Iv 1 year after the start of the lockdown. The bars show the partial variance of the individual model parameters. Higher bars indicate greater sensitivity of the model to that parameter. See the electronic supplementary material, Methods for details of the sensitivity analysis and parameter ranges used. (a) Description of explored β value ‘blocks’ for the sensitivity analysis. β1, β2, β3 and β4 were broken down further to assess the sensitivity of the system to these values in greater detail. Lettering denotes the explored β in the FAST analysis. (b) Sensitivity of the model outcome measures to the β values specified in (a). (c) Sensitivity of the model outcome measures to β1, β2, β3 and β4.
Figure 5.
Figure 5.
Heat maps showing the trade-off between relaxation (left to right on the horizontal axis) and increasing protection (top to bottom on the vertical axis). (a) Heat maps describing the cumulative infected vulnerable fraction (Iv) 1 year after the start of lockdown for different combinations of β3 and β4 for different values of β1 (rows) and β2 (columns). (b) As (a) but for whether the second peak of Iv is lower (green) or higher (red) than the first peak. (c) As (b) but all second peaks (Iv, Is, Ig) smaller than first peaks (green). (d) As (b) but dI/dt is negative or zero for at least 1 year after the start of lockdown for all I-compartments. (Online version in colour.)
Figure 6.
Figure 6.
Heat maps showing the trade-off between relaxation (left to right on the horizontal axis) and increasing protection (top to bottom on the vertical axis) for the different models considered. The green shading indicates which of the policy objectives is met. Dark green: the second peak of Iv is lower than the first peak. Middle green: as dark green plus all second peaks (Iv, Is, Ig) lower than first peaks. Light green: as middle green but dI/dt is negative or zero for at least one year after the start of lockdown for all I-compartments. Red: none of the policy objectives is met. (Online version in colour.)

References

    1. World Health Organisation. 2020. Coronavirus disease 2019 (COVID-19) situation report – 51. Geneva, Switzerland: WHO.
    1. World Health Organisation. 2020. Coronavirus disease (COVID-2019) situation reports. See https://www.who.int/emergencies/diseases/novel-coronavirus-2019/situatio... (accessed: 26 April 2020).
    1. Organisation for Economic Co-operation and Development. 2020. OECD policy responses to coronavirus (COVID-19): evaluating the initial impact of COVID-19 containment measures on economic activity. See https://www.oecd.org/coronavirus/policy-responses/evaluating-the-initial... (accessed: 26 April 2020).
    1. Low LL, Kwan YH, Liu N, Jing X, Low EC, Thumboo J. 2017. Evaluation of a practical expert defined approach to patient population segmentation: a case study in Singapore. BMC Health Serv. Res. 17, 1-8. (10.1186/s12913-016-1943-z) - DOI - PMC - PubMed
    1. British Lung Foundation. 2020. Coronavirus and COVID-19: what is social shielding and who needs to do this? See https://www.blf.org.uk/support-for-you/coronavirus/what-is-social-shielding (accessed: 26 April 2020).

Publication types

LinkOut - more resources