. 2021 Jul 19;376(1829):20200264.
doi: 10.1098/rstb.2020.0264. Epub 2021 May 31.

Challenges in control of COVID-19: short doubling time and long delay to effect of interventions

Affiliations

Challenges in control of COVID-19: short doubling time and long delay to effect of interventions

Lorenzo Pellis et al. Philos Trans R Soc Lond B Biol Sci. .

Abstract

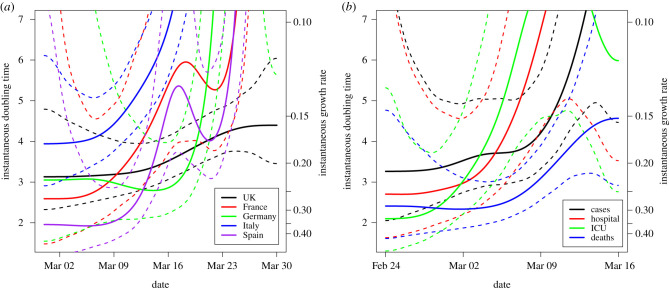
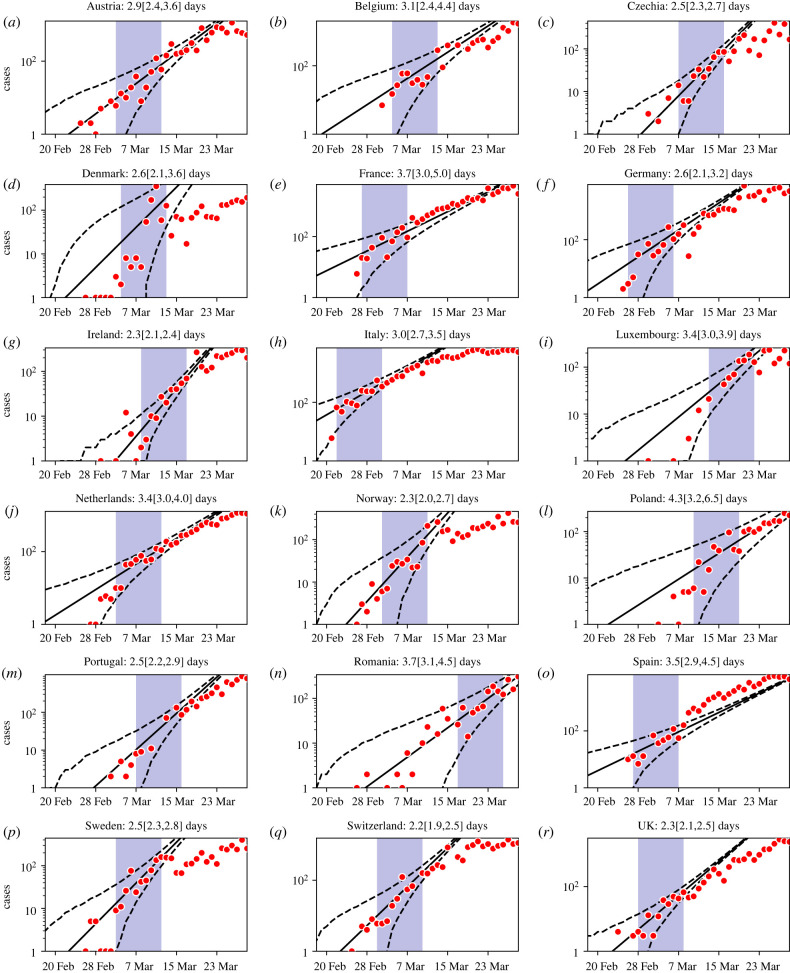
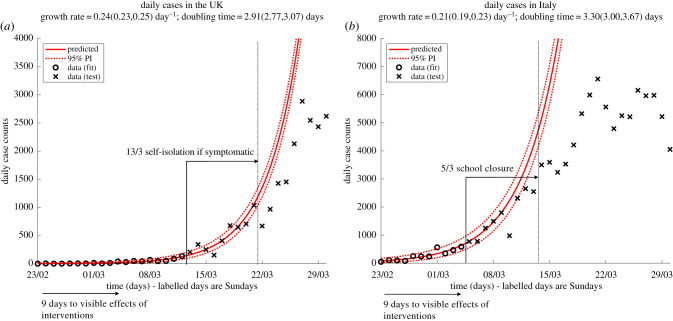
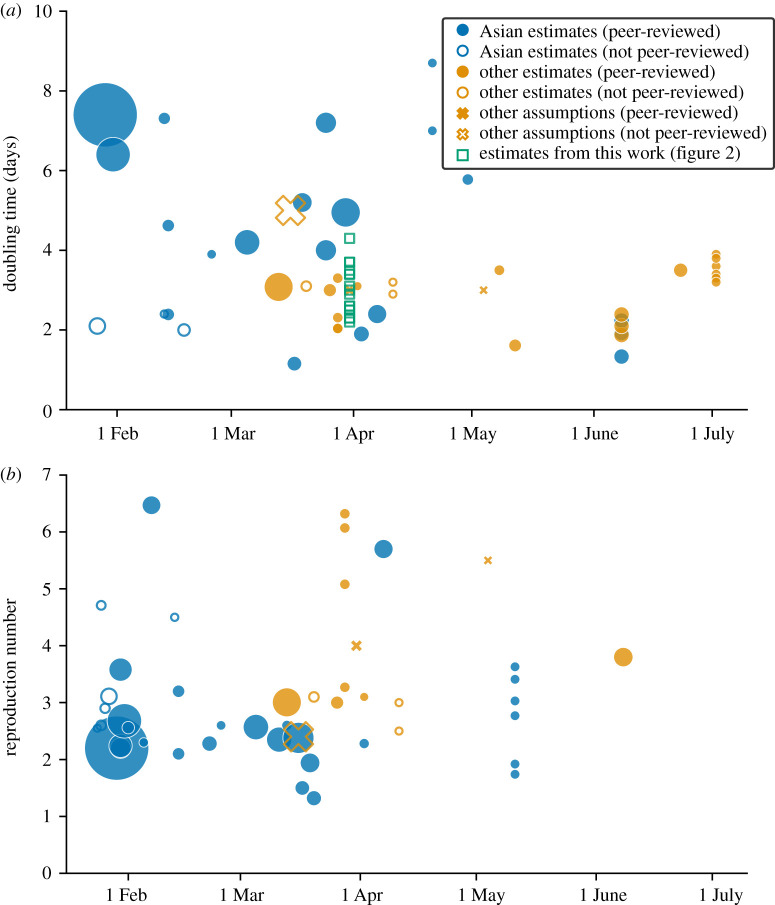
Early assessments of the growth rate of COVID-19 were subject to significant uncertainty, as expected with limited data and difficulties in case ascertainment, but as cases were recorded in multiple countries, more robust inferences could be made. Using multiple countries, data streams and methods, we estimated that, when unconstrained, European COVID-19 confirmed cases doubled on average every 3 days (range 2.2-4.3 days) and Italian hospital and intensive care unit admissions every 2-3 days; values that are significantly lower than the 5-7 days dominating the early published literature. Furthermore, we showed that the impact of physical distancing interventions was typically not seen until at least 9 days after implementation, during which time confirmed cases could grow eightfold. We argue that such temporal patterns are more critical than precise estimates of the time-insensitive basic reproduction number R0 for initiating interventions, and that the combination of fast growth and long detection delays explains the struggle in countries' outbreak response better than large values of R0 alone. One year on from first reporting these results, reproduction numbers continue to dominate the media and public discourse, but robust estimates of unconstrained growth remain essential for planning worst-case scenarios, and detection delays are still key in informing the relaxation and re-implementation of interventions. This article is part of the theme issue 'Modelling that shaped the early COVID-19 pandemic response in the UK'.

Keywords: early growth rate; incubation period; non-pharmaceutical interventions; onset-to-hospitalization delay; reproduction number; unconstrained epidemic.


Figures

Figure 1.
Figure 1.
Time-varying doubling time from multiple countries and data streams. Instantaneous doubling time (left axis) and growth rate (right axis), with 95% confidence intervals (CIs, dashed) obtained by fitting a GAM with quasi-Poisson family and canonical link to data, adjusted by day-of-week fixed effect (see the electronic supplementary material), to (a) daily confirmed cases of the five largest European epidemics since the beginning of March 2020, and (b) different surveillance data streams within Italy since late February 2020. The approximately constant values observed in the early epidemic in each country describe the phase of unconstrained exponential growth, before physical distancing slowed it down. Notice that the apparent 4-day doubling time for confirmed cases in Italy at the beginning of March (a) is already higher than the unconstrained doubling time of just over 3 days visible in late February (b). Hospital and ICU daily counts were obtained from bed occupancy data to provide a fairer comparison in both point estimate and uncertainty with daily confirmed cases and deaths, under the assumption that hospital and ICU length of stay is long enough that discharges are negligible in the time frame considered.
Figure 2.
Figure 2.
Unconstrained doubling times across Europe. Log daily confirmed cases (red dots) and exponential fit (solid) and 95% CIs (dashed black lines) for all European countries with more than 1000 cumulative confirmed cases by 27 March, obtained using a GLM (see the electronic supplementary material) in the 9-day data period after a cumulative incidence of 20 is reached (shaded area). Slight adjustments to Denmark and Romania reflect their particular circumstances (see the electronic supplementary material). Doubling times with 95% CIs are reported above each panel.
Figure 3.
Figure 3.
Observed deviation from unconstrained exponential growth approximately 9 days after the first publicly announced nationwide intervention. Daily confirmed cases in (a) the UK and (b) Italy before intervention (circles) are fitted with a GLM with 95% negative binomial prediction intervals around the central estimate (dashed red lines; see the electronic supplementary material). Crosses are data not used for fitting. Maximum-likelihood estimates of growth rates and doubling times, with asymptotic 95% CIs, are reported above each panel.
Figure 4.
Figure 4.
Estimates of (a) unconstrained (or early) doubling time, and (b) basic (or early) reproduction number published in the first half of 2020, by date of publication. The size of the marker indicates the number of Google Scholar citations recorded between 31 March and 1 April 2021. Publications with fewer than 100 citations are not shown, with the exception of the estimates presented in this paper (green squares). Filled markers denote peer-reviewed publications and empty markers preprints or other reports. Circle markers denote estimates obtained from data (whether made available or not) and crosses are values presented as assumptions or statements with no clear source. Blue colour denotes publications using data from, or presenting results for, countries in Asia, while yellow is used for all other countries. Publications have been extracted from Google Scholar between 31 March and 1 April 2021, with searches [(‘doubling time’ OR ‘growth rate’) AND (covid OR SARS-CoV-2)] and [‘basic reproduction number’ AND (covid OR SARS-CoV-2)]. The resulting filtered list is available at https://github.com/thomasallanhouse/covid19-growth. Longer doubling time estimates and low reproduction numbers dominated the cited literature at the time of first submission (a citation count collected on 18 April 2020 for the most cited publications in this figure resulted in fewer citations, but in broadly similar proportions, thus providing the same qualitative picture—not shown), and still dominate it now. Although longer doubling times observed in Asia could in principle be attributable to a different variant [53], short doubling times were also obtained from China, both early on (e.g. in January 2020 by Read et al. [54], also published in this Special Issue) and in later studies re-analysing early data [41,55].

References

    1. World Health Organization (WHO). 2020. WHO Director-General's opening remarks at the media briefing on COVID-19 – 11 March 2020. See https://www.who.int/dg/speeches/detail/who-director-general-s-opening-re... (accessed on 29 March 2020).
    1. Liu Y, Gayle AA, Wilder-Smith A, Rocklöv J. 2020. The reproductive number of COVID-19 is higher compared to SARS coronavirus. J. Travel Med. 27, taaa021. (10.1093/jtm/taaa021) - DOI - PMC - PubMed
    1. World Health Organisation (WHO). 2020. Coronavirus disease (COVID-2019) situation report 69, 29 March 2020. See https://www.who.int/docs/default-source/coronaviruse/situation-reports/2... (accessed on 29 March 2020).
    1. World Health Organization (WHO) and the Chinese Centre for Disease Control and Prevention. 2020 Report of the WHO-China joint mission on Coronavirus disease 2019 (COVID-19). See https://www.who.int/docs/default-source/coronaviruse/who-china-joint-mis... (accessed on 29 March 2020).
    1. Istituto Superiore di Sanità. 2020. Daily reports, (29.03.2020). See http://www.salute.gov.it/portale/news/p3_2_1.jsp?lingua=italiano&menu=no....

Publication types

LinkOut - more resources