. 2021 Jul 19;376(1829):20200266.
doi: 10.1098/rstb.2020.0266. Epub 2021 May 31.

Real-time monitoring of COVID-19 dynamics using automated trend fitting and anomaly detection

Affiliations

Real-time monitoring of COVID-19 dynamics using automated trend fitting and anomaly detection

Thibaut Jombart et al. Philos Trans R Soc Lond B Biol Sci. .

Abstract

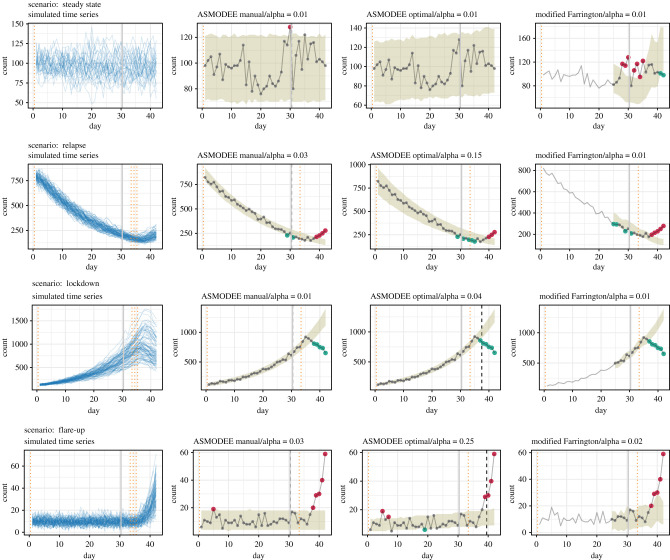
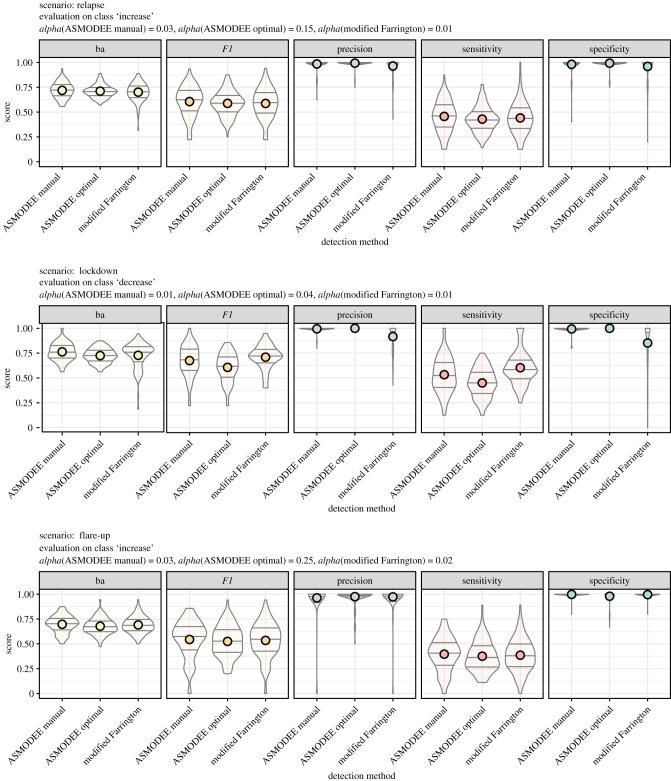
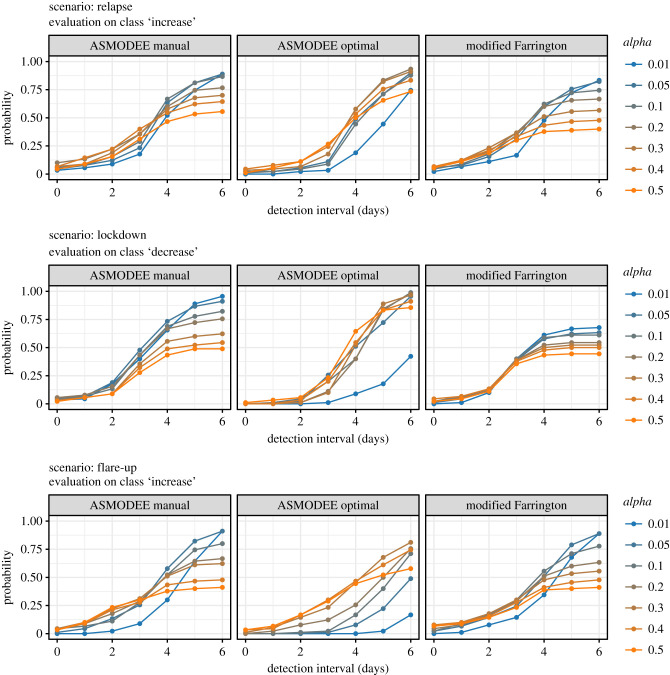
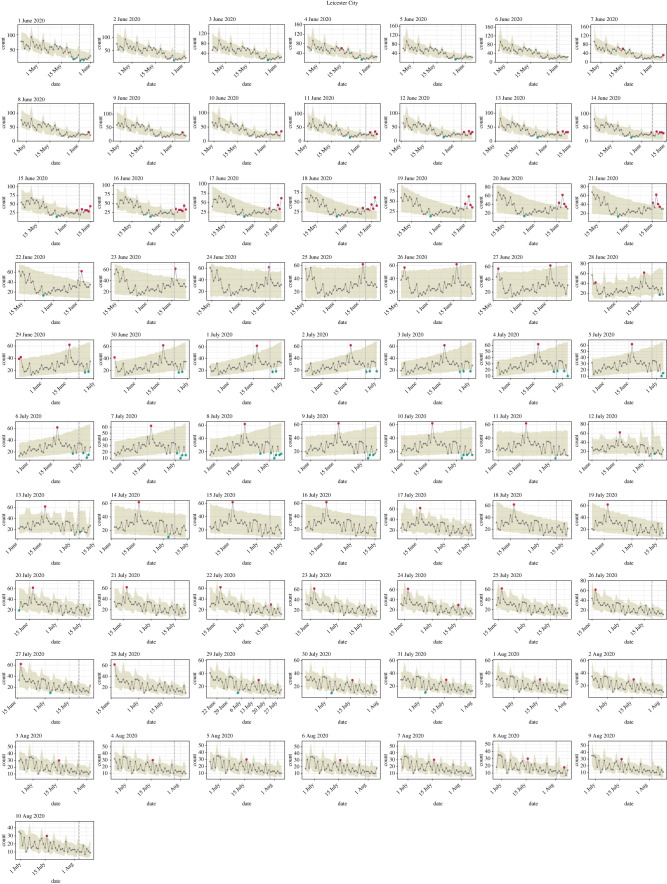
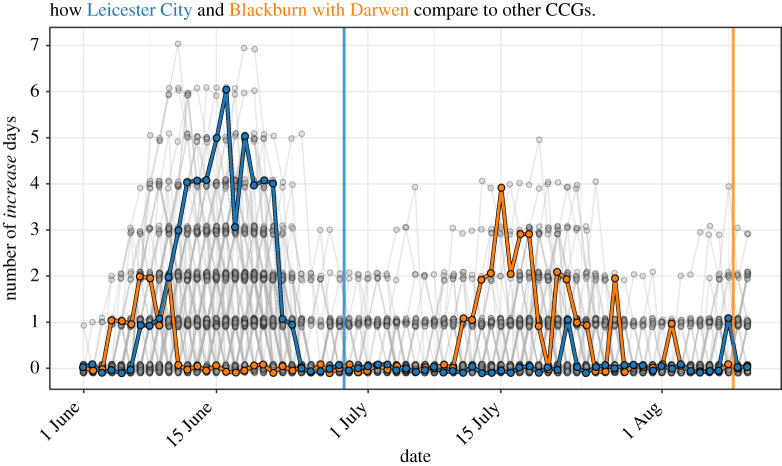
As several countries gradually release social distancing measures, rapid detection of new localized COVID-19 hotspots and subsequent intervention will be key to avoiding large-scale resurgence of transmission. We introduce ASMODEE (automatic selection of models and outlier detection for epidemics), a new tool for detecting sudden changes in COVID-19 incidence. Our approach relies on automatically selecting the best (fitting or predicting) model from a range of user-defined time series models, excluding the most recent data points, to characterize the main trend in an incidence. We then derive prediction intervals and classify data points outside this interval as outliers, which provides an objective criterion for identifying departures from previous trends. We also provide a method for selecting the optimal breakpoints, used to define how many recent data points are to be excluded from the trend fitting procedure. The analysis of simulated COVID-19 outbreaks suggests ASMODEE compares favourably with a state-of-art outbreak-detection algorithm while being simpler and more flexible. As such, our method could be of wider use for infectious disease surveillance. We illustrate ASMODEE using publicly available data of National Health Service (NHS) Pathways reporting potential COVID-19 cases in England at a fine spatial scale, showing that the method would have enabled the early detection of the flare-ups in Leicester and Blackburn with Darwen, two to three weeks before their respective lockdown. ASMODEE is implemented in the free R package trendbreaker. This article is part of the theme issue 'Modelling that shaped the early COVID-19 pandemic response in the UK'.

Keywords: ASMODEE; algorithm; machine learning; outbreak; surveillance; trendbreaker.


Figures

Figure 1.
Figure 1.
Simulations under four scenarios and illustration of the detection algorithm. Left column: the blue lines show time series generated under the four scenarios steady state (30 simulations), relapse, lockdown and flare-up (90 simulations each). The vertical solid grey lines mark the beginning of the observation period, the dotted orange lines the time at which a trend change occurs. Second to fourth columns: application on a single time series from each scenario of the configurations ASMODEE manual, ASMODEE optimal and the modified Farrington algorithms. The grey lines show the simulated time series, the ribbons show the prediction interval for the value of alpha indicated, and the dashed black lines mark the end of the calibration period for ASMODEE. The red dots show data points categorized as increase, the green dots those categorized as decrease, the grey ones are considered normal. The values of alpha were set so as to maximize the 6-day probability of detection. modified Farrington does not produce results for the first training period.
Figure 2.
Figure 2.
Evaluation of the algorithm on simulated data. Distribution of scores over all simulation runs. Each row corresponds to a different scenario, each column to one score, computed for each algorithm. ‘ba’ stands for balanced accuracy, the average of sensitivity and specificity. The horizontal lines correspond to the 25th, 50th and 75th percentiles, the dots correspond to the average. The plot title indicates which class was considered positive for each scenario and which value of alpha was considered optimal. (The trivial results for the steady state scenario, with a sensitivity very close to 1 and other scores undefined, are not shown.).
Figure 3.
Figure 3.
Delay to trend change detection. This figure illustrates the delay between the change in Rt and the first detected change (increase or decrease) by the different methods. The probability of detection on the y-axis is defined as the proportion of simulations where a trend change was detected, conditionally on no changes having been detected (false positive) before. Results are provided for selected values of the threshold parameter alpha, represented in colour. (The trivial results for the steady state scenario are not shown.).
Figure 4.
Figure 4.
ASMODEE applied to the COVID-19 cases reported through the NHS Pathways (111/999 calls) for the CCG Leicester City during June and July and the first 10 days of August 2020. Each plot corresponds to a different reference date, with the algorithm applied to the preceding 42 days (including the reference day). k was fixed to 7 days, alpha was set to 0.05. Considered temporal trends models included: Poisson GLM with constant mean, linear regression with linear trend in time, negative binomial GLM with log-linear trend in time, the same with a ‘day of the week’ effect (distinguishing weekends, Mondays and other days), and the latter with an additional interaction to allow for different slopes by day of the week. Automated model selection using AIC was used for all analyses.
Figure 5.
Figure 5.
Leicester City and Blackburn with Darwen stand out among all CCGs from 1 June until 10 August 2020. Number of days classified as increase within 7 days of the reference date. Each dot represents one CCG on one reference day, the lines connect the dots corresponding to the same CCGs from one day to the next. Leicester City is highlighted in blue, Blackburn with Darwen in orange. A small jitter was applied for better readability. The blue and orange vertical lines indicate the dates at which increased restrictions were imposed in Leicester and Blackburn, respectively.

References

    1. Lai S, et al. . 2020. Effect of non-pharmaceutical interventions for containing the COVID-19 outbreak in China. medRxiv. (10.1101/2020.03.03.20029843) - DOI
    1. Courtemanche C, Garuccio J, Le A, Pinkston J, Yelowitz A. 2020. Strong social distancing measures in the United States reduced the COVID-19 growth rate: study evaluates the impact of social distancing measures on the growth rate of confirmed COVID-19 cases across the United States. Health Aff. 10, 1377. (10.4324/9781003141402-20) - DOI - PubMed
    1. Davies NG, et al. . 2020. Effects of non-pharmaceutical interventions on COVID-19 cases, deaths, and demand for hospital services in the UK: a modelling study. Lancet Public Health 5, e375-e385. (10.1016/S2468-2667(20)30133-X) - DOI - PMC - PubMed
    1. Long Q-X, et al. . 2020. Clinical and immunological assessment of asymptomatic SARS-CoV-2 infections. Nat. Med. 26, 1200-1204. (10.1038/s41591-020-0965-6) - DOI - PubMed
    1. Grifoni A, et al. . 2020. Targets of T cell responses to SARS-CoV-2 coronavirus in humans with COVID-19 disease and unexposed individuals. Cell 181, 1489-1501. (10.1016/j.cell.2020.05.015) - DOI - PMC - PubMed

Publication types