

A data-driven metapopulation model for the Belgian COVID-19 epidemic: assessing the impact of lockdown and exit strategies
- PMID: 34053446
- PMCID: PMC8164894
- DOI: 10.1186/s12879-021-06092-w
A data-driven metapopulation model for the Belgian COVID-19 epidemic: assessing the impact of lockdown and exit strategies
Abstract
Background: In response to the ongoing COVID-19 pandemic, several countries adopted measures of social distancing to a different degree. For many countries, after successfully curbing the initial wave, lockdown measures were gradually lifted. In Belgium, such relief started on May 4th with phase 1, followed by several subsequent phases over the next few weeks.
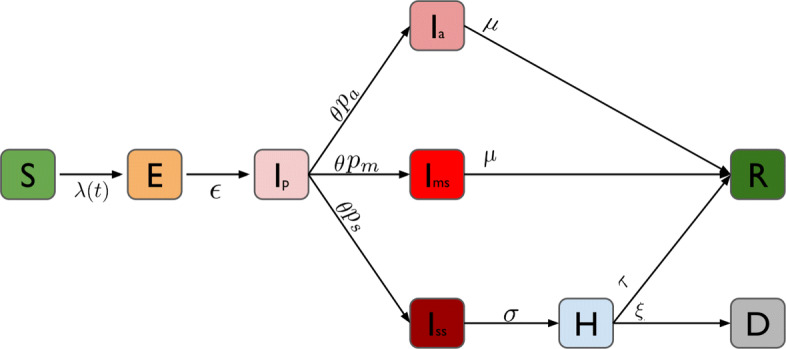
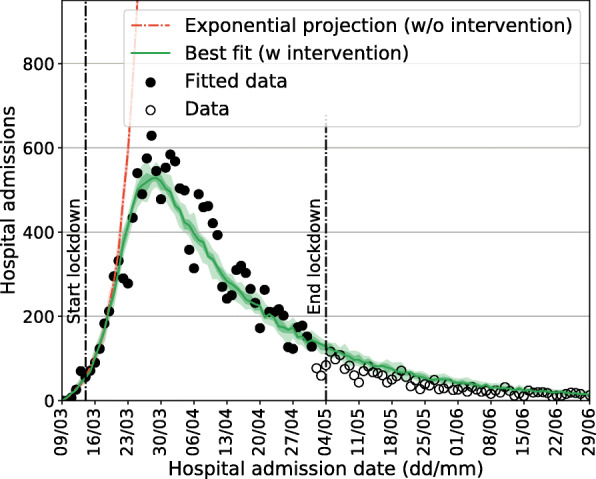
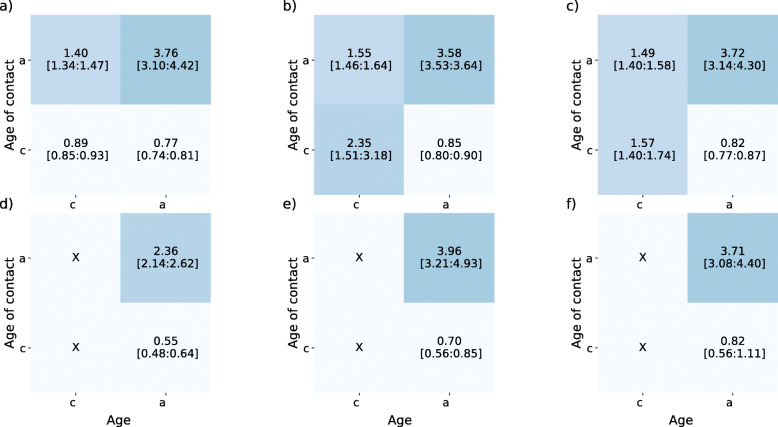
Methods: We analysed the expected impact of relaxing stringent lockdown measures taken according to the phased Belgian exit strategy. We developed a stochastic, data-informed, meta-population model that accounts for mixing and mobility of the age-structured population of Belgium. The model is calibrated to daily hospitalization data and is able to reproduce the outbreak at the national level. We consider different scenarios for relieving the lockdown, quantified in terms of relative reductions in pre-pandemic social mixing and mobility. We validate our assumptions by making comparisons with social contact data collected during and after the lockdown.
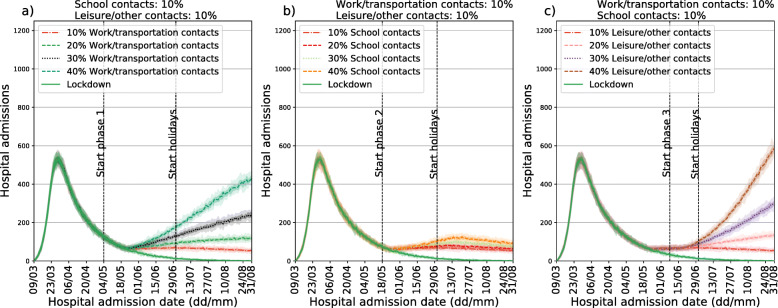
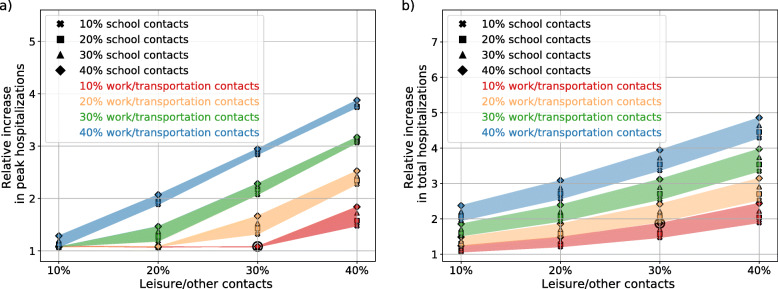
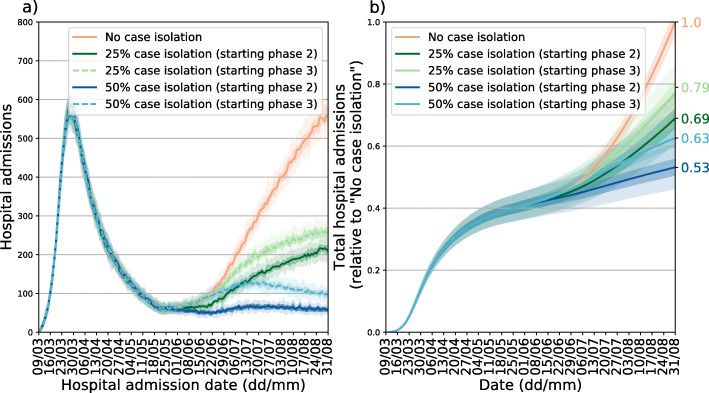
Results: Our model is able to successfully describe the initial wave of COVID-19 in Belgium and identifies interactions during leisure/other activities as pivotal in the exit strategy. Indeed, we find a smaller impact of school re-openings as compared to restarting leisure activities and re-openings of work places. We also assess the impact of case isolation of new (suspected) infections, and find that it allows re-establishing relatively more social interactions while still ensuring epidemic control. Scenarios predicting a second wave of hospitalizations were not observed, suggesting that the per-contact probability of infection has changed with respect to the pre-lockdown period.
Conclusions: Contacts during leisure activities are found to be most influential, followed by professional contacts and school contacts, respectively, for an impending second wave of COVID-19. Regular re-assessment of social contacts in the population is therefore crucial to adjust to evolving behavioral changes that can affect epidemic diffusion.
Keywords: Behavioral changes; COVID-19; Epidemic modeling; Metapopulation; Mixing patterns; Spatial transmission.
Conflict of interest statement
The authors declare that they have no competing interests.
Figures
References
-
- Prem K, Liu Y, Russell TW, Kucharski AJ, Eggo RM, Davies N, Flasche S, Clifford S, Pearson CAB, Munday JD, Abbott S, Gibbs H, Rosello A, Quilty BJ, Jombart T, Sun F, Diamond C, Gimma A, van Zandvoort K, Funk S, Jarvis CI, Edmunds WJ, Bosse NI, Hellewell J, Jit M, Klepac P. The effect of control strategies to reduce social mixing on outcomes of the COVID-19 epidemic in Wuhan, China: a modelling study. Lancet Publ Health. 2020:261–70. 10.1016/S2468-2667(20)30073-. - PMC - PubMed
-
- Riccardo F, Ajelli M, Andrianou X, Bella A, Del Manso M, Fabiani M, Bellino S, Boros S, Mateo Urdiales A, Marziano V, Rota MC, Filia A, D extquoterightAncona FP, Siddu A, Punzo O, Trentini F, Guzzetta G, Poletti P, Stefanelli P, Castrucci MR, Ciervo A, Di Benedetto C, Tallon M, Piccioli A, Brusaferro S, Rezza G, Merler S, Pezzotti P. Epidemiological characteristics of COVID-19 cases in italy and estimates of the reproductive numbers one month into the epidemic. medRxiv. 2020. 10.1101/2020.04.08.20056861. - PubMed
MeSH terms
Grants and funding
LinkOut - more resources
Full Text Sources
Other Literature Sources
Medical
