

Detecting multiple generalized change-points by isolating single ones
- PMID: 34054146
- PMCID: PMC8142888
- DOI: 10.1007/s00184-021-00821-6
Detecting multiple generalized change-points by isolating single ones
Abstract
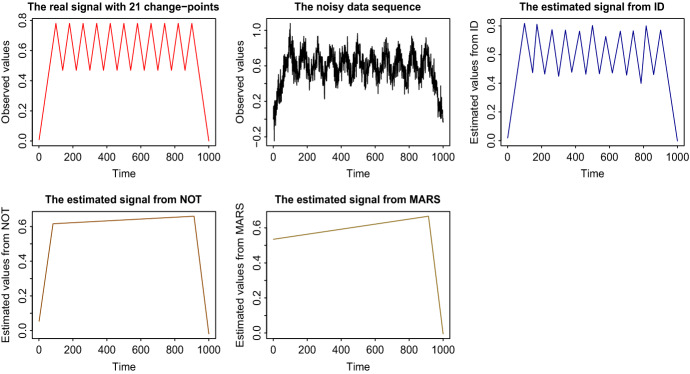
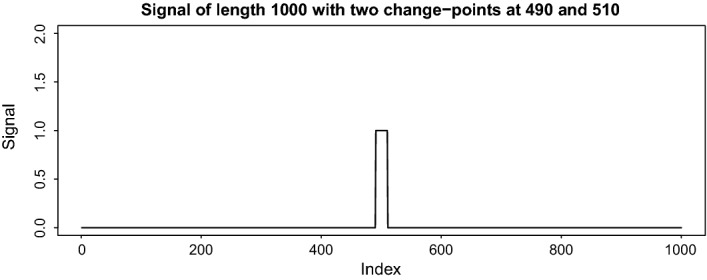
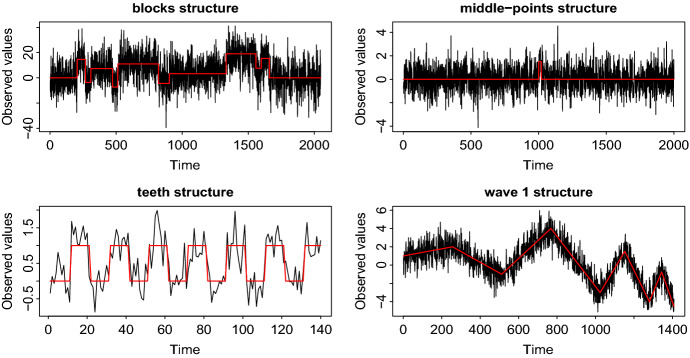
We introduce a new approach, called Isolate-Detect (ID), for the consistent estimation of the number and location of multiple generalized change-points in noisy data sequences. Examples of signal changes that ID can deal with are changes in the mean of a piecewise-constant signal and changes, continuous or not, in the linear trend. The number of change-points can increase with the sample size. Our method is based on an isolation technique, which prevents the consideration of intervals that contain more than one change-point. This isolation enhances ID's accuracy as it allows for detection in the presence of frequent changes of possibly small magnitudes. In ID, model selection is carried out via thresholding, or an information criterion, or SDLL, or a hybrid involving the former two. The hybrid model selection leads to a general method with very good practical performance and minimal parameter choice. In the scenarios tested, ID is at least as accurate as the state-of-the-art methods; most of the times it outperforms them. ID is implemented in the R packages IDetect and breakfast, available from CRAN.
Supplementary information: The online version supplementary material available at 10.1007/s00184-021-00821-6.
Keywords: SDLL; Schwarz information criterion; Segmentation; Symmetric interval expansion; Threshold criterion.
© The Author(s) 2021, corrected publication 2021.
Conflict of interest statement
Conflict of interestOn behalf of all authors, the corresponding author states that there is no conflict of interest.
Figures


References
-
- Anscombe FJ. The transformation of Poisson, binomial and negative-binomial data. Biometrika. 1948;35:246–254. doi: 10.1093/biomet/35.3-4.246. - DOI
-
- Bai J, Perron P. Estimating and testing linear models with multiple structural changes. Econometrica. 1998;66:47–78. doi: 10.2307/2998540. - DOI
-
- Baranowski R, Chen Y, Fryzlewicz P. Narrowest-over-threshold detection of multiple change points and change-point-like features. J R Stat Soc B. 2019;81:649–672. doi: 10.1111/rssb.12322. - DOI
-
- Chan HP, Walther G. Detection with the scan and the average likelihood ratio. Stat Sin. 2013;23:409–428.
LinkOut - more resources
Full Text Sources
Other Literature Sources