

Analysis of Increased EGFR and IGF-1R Signaling and Its Correlation with Socio-Epidemiological Features and Biological Profile in Breast Cancer Patients: A Study in Northern Brazil
- PMID: 34054308
- PMCID: PMC8153070
- DOI: 10.2147/BCTT.S308554
Analysis of Increased EGFR and IGF-1R Signaling and Its Correlation with Socio-Epidemiological Features and Biological Profile in Breast Cancer Patients: A Study in Northern Brazil
Abstract
Introduction: Breast cancer (BC) is the second most frequent cancer worldwide. It is known that a subset of BC has amplification, and overexpression of the epidermal growth factor receptor (EGFR) and high expression of the insulin-like growth factor receptor-1 (IGF-1R) are correlated with a favorable prognosis. This study aimed to evaluate the prognostic and predictive values of the EGFR and IGF-1R in tumor samples from patients with BC and their correlation with socio-epidemiological features.
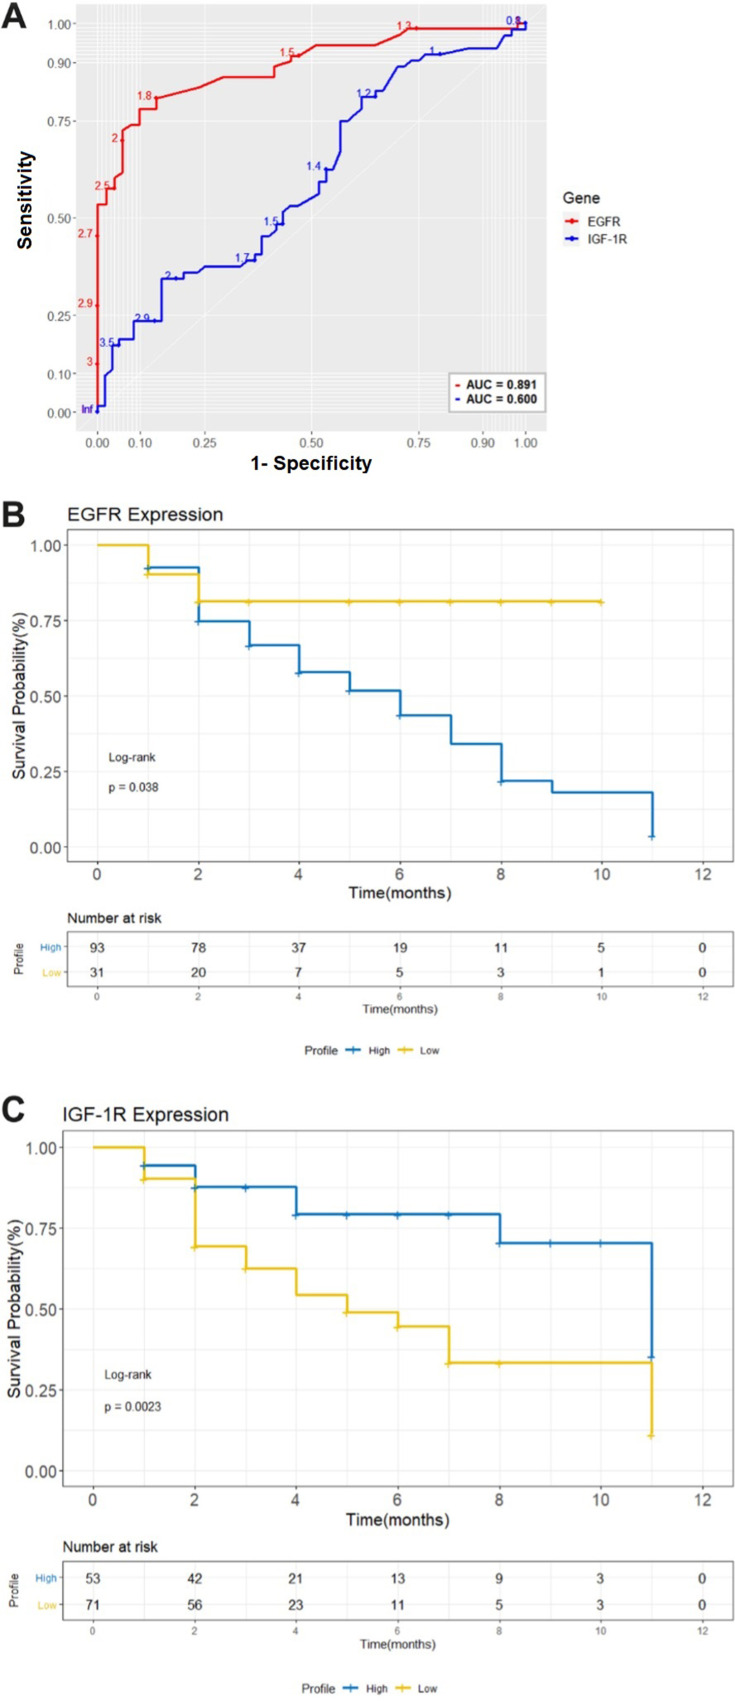
Patients and methods: We analyzed socio-epidemiological, clinical-pathological data and tumor tissues from 124 patients with BC undergoing treatment, to assess levels of EGFR and IGF-1R mRNA and protein. The predictive performance included the calculation of area-under-the-curve (AUC) to discriminate groups of patients with high and low mRNA expression associated with survival analysis within each molecular group of BC.
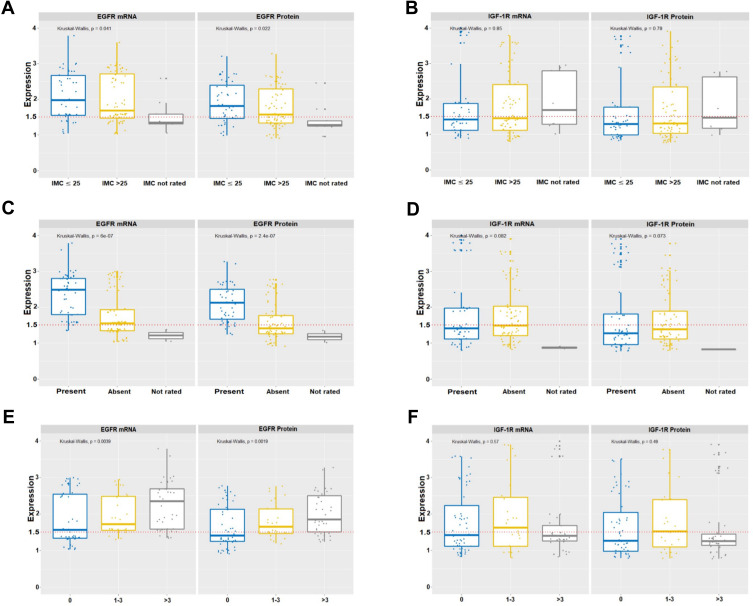
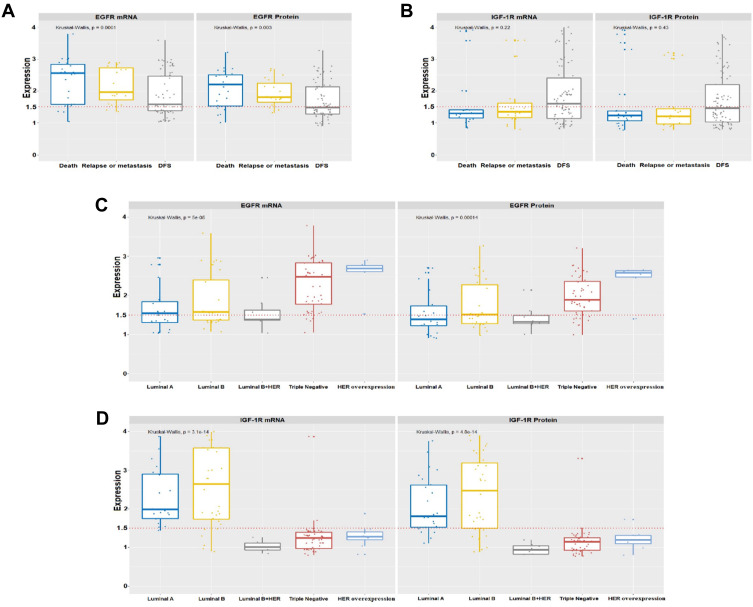
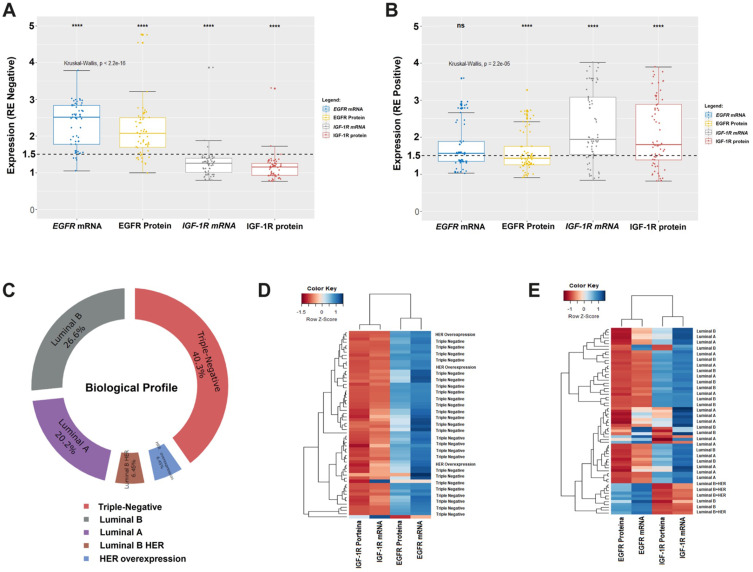
Results: We found a significant expression increase (p <0.001) in EGFR associated with body mass index, angiolymphatic invasion, compromised lymph nodes and follow-up in 58.1% of the triple-negative and HER overexpression tumors. The increase in IGF-IR was significant (p <0.001) in 41.9% of luminal tumors A and B. ROC analysis showed that EGFR had a higher predictive performance (AUC = 0.891) than IGF-1R (AUC = 0.60). The Kaplan-Meier analysis indicated that only the high expression of EGFR was associated with a decreased probability of survival for patients, what did not happen with IGF-1R.
Conclusion: Our results suggest that EGFR and IGF-1R expression patterns associated with the clinical characteristics of patients and biological profile influenced the evolution of BC.
Keywords: EGFR; IGF-IR; breast cancer; hormonal receptors; predictive performance.
© 2021 Silva Rocha et al.
Conflict of interest statement
The authors declare that they have no conflicts of interest for this work.
Figures
Similar articles
-
Expression and clinical significance of epidermal growth factor receptor and insulin-like growth factor receptor 1 in patients with ampullary adenocarcinoma.Hum Pathol. 2015 Sep;46(9):1315-22. doi: 10.1016/j.humpath.2015.05.012. Epub 2015 May 30. Hum Pathol. 2015. PMID: 26165226
-
Expression of insulin-like growth factor 1 receptor (IGF-1R) predicts poor responses to epidermal growth factor receptor (EGFR) tyrosine kinase inhibitors in non-small cell lung cancer patients harboring activating EGFR mutations.Lung Cancer. 2015 Mar;87(3):311-7. doi: 10.1016/j.lungcan.2015.01.004. Epub 2015 Jan 14. Lung Cancer. 2015. PMID: 25617986
-
Co-inhibition of epidermal growth factor receptor and insulin-like growth factor receptor 1 enhances radiosensitivity in human breast cancer cells.BMC Cancer. 2013 Jun 19;13:297. doi: 10.1186/1471-2407-13-297. BMC Cancer. 2013. PMID: 23777562 Free PMC article.
-
Epidermal growth factor receptor/HER2/insulin-like growth factor receptor signalling and oestrogen receptor activity in clinical breast cancer.Endocr Relat Cancer. 2005 Jul;12 Suppl 1:S99-S111. doi: 10.1677/erc.1.01005. Endocr Relat Cancer. 2005. PMID: 16113104 Review.
-
Insulin receptor (IR) and insulin-like growth factor receptor 1 (IGF-1R) signaling systems: novel treatment strategies for cancer.Med Oncol. 2014 Jan;31(1):805. doi: 10.1007/s12032-013-0805-3. Epub 2013 Dec 14. Med Oncol. 2014. PMID: 24338270 Review.
Cited by
-
Obesity and endocrine-related cancer: The important role of IGF-1.Front Endocrinol (Lausanne). 2023 Jan 23;14:1093257. doi: 10.3389/fendo.2023.1093257. eCollection 2023. Front Endocrinol (Lausanne). 2023. PMID: 36755926 Free PMC article. Review.
-
Association of Lutein with Cancer: A Systematic Review of the Lutein Effects on Cellular Processes Involved in Cancer Progression.Prev Nutr Food Sci. 2025 Jun 30;30(3):250-262. doi: 10.3746/pnf.2025.30.3.250. Prev Nutr Food Sci. 2025. PMID: 40612761 Free PMC article.
References
LinkOut - more resources
Full Text Sources
Other Literature Sources
Research Materials
Miscellaneous
