

Informing Pharmacokinetic Models With Physiological Data: Oral Population Modeling of L-Serine in Humans
- PMID: 34054524
- PMCID: PMC8156419
- DOI: 10.3389/fphar.2021.643179
Informing Pharmacokinetic Models With Physiological Data: Oral Population Modeling of L-Serine in Humans
Abstract
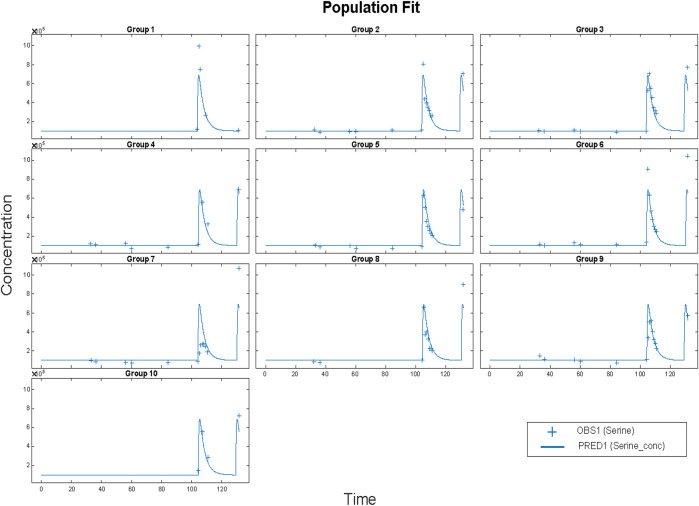
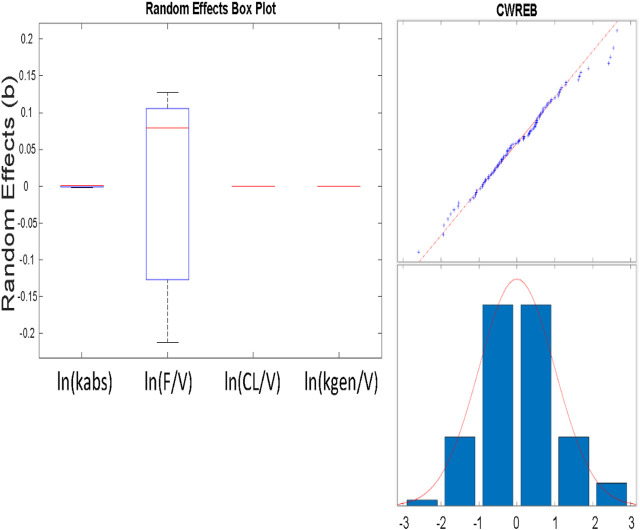
To determine how to set optimal oral L-serine (serine) dose levels for a clinical trial, existing literature was surveyed. Data sufficient to set the dose was inadequate, and so an (n = 10) phase I-A calibration trial was performed, administering serine with and without other oral agents. We analyzed the trial and the literature data using pharmacokinetic (PK) modeling and statistical analysis. The therapeutic goal is to modulate specific serine-related metabolic pathways in the liver using the lowest possible dose which gives the desired effect since the upper bound was expected to be limited by toxicity. A standard PK approach, in which a common model structure was selected using a fit to data, yielded a model with a single central compartment corresponding to plasma, clearance from that compartment, and an endogenous source of serine. To improve conditioning, a parametric structure was changed to estimate ratios (bioavailability over volume, for example). Model fit quality was improved and the uncertainty in estimated parameters was reduced. Because of the particular interest in the fate of serine, the model was used to estimate whether serine is consumed in the gut, absorbed by the liver, or entered the blood in either a free state, or in a protein- or tissue-bound state that is not measured by our assay. The PK model structure was set up to represent relevant physiology, and this quantitative systems biology approach allowed a broader set of physiological data to be used to narrow parameter and prediction confidence intervals, and to better understand the biological meaning of the data. The model results allowed us to determine the optimal human dose for future trials, including a trial design component including IV and tracer studies. A key contribution is that we were able to use human physiological data from the literature to inform the PK model and to set reasonable bounds on parameters, and to improve model conditioning. Leveraging literature data produced a more predictive, useful model.
Keywords: L-Serine (ser); NAFLD (non alcoholic fatty liver disease); Pharmacokinectics; oral supplementation; systems biology.
Copyright © 2021 Bosley, Björnson, Zhang, Turkez, Nielsen, Uhlen, Borén and Mardinoglu.
Conflict of interest statement
JRB is the founder of Clermont Bosley LLC. AM, JB, and MU are the founder and shareholders of ScandiBio Therapeutics and ScandiEdge Therapeutics. The remaining authors declare that the research was conducted in the absence of any commercial or financial relationships that could be construed as a potential conflict of interest.
Figures
References
-
- Calzia E., Iványi Z., Radermacher P. (2005). “Determinants of Blood Flow and Organ Perfusion,” in Functional Hemodynamic Monitoring (Springer; ), 19–32.
LinkOut - more resources
Full Text Sources
Other Literature Sources