Tang Luo Ning, a Traditional Chinese Compound Prescription, Ameliorates Schwannopathy of Diabetic Peripheral Neuropathy Rats by Regulating Mitochondrial Dynamics In Vivo and In Vitro
- PMID: 34054529
- PMCID: PMC8160508
- DOI: 10.3389/fphar.2021.650448
Tang Luo Ning, a Traditional Chinese Compound Prescription, Ameliorates Schwannopathy of Diabetic Peripheral Neuropathy Rats by Regulating Mitochondrial Dynamics In Vivo and In Vitro
Erratum in
-
Corrigendum: Tang Luo Ning, a Traditional Chinese Compound Prescription, Ameliorates Schwannopathy of Diabetic Peripheral Neuropathy Rats by Regulating Mitochondrial Dynamics In Vivo and In Vitro.Front Pharmacol. 2021 Jul 22;12:718452. doi: 10.3389/fphar.2021.718452. eCollection 2021. Front Pharmacol. 2021. PMID: 34366870 Free PMC article.
Abstract
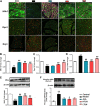
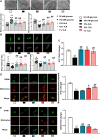
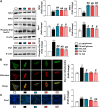
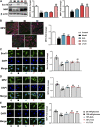
Tang Luo Ning (TLN), a traditional Chinese compound prescription, has been used clinically to treat diabetic peripheral neuropathy (DPN) in China. However, the exact mechanisms remain unclear. The objective of this study is to unravel the effects of TLN on mitochondrial dynamics of DPN in streptozotocin-induced rat models and Schwann cells cultured in 150 mM glucose. Mitochondrial function was determined by Ca2+ and ATP levels of streptozotocin (STZ)-induced DPN rats and mitochondria structure, mitochondrial membrane potential (MMP), and mtDNA of high glucose incubated SCs. Mitochondrial dynamics protein including mitofusin 1 (Mfn1), mitofusin 2 (Mfn2), optic atrophy 1 (Opa1), and dynamin-related protein 1 (Drp1) were investigated using Western blot or immunofluorescence. Myelin basic protein (MBP), myelin protein zero (MPZ), and sex-determining region Y (SRY)-box 10 (Sox10) were measured to represent schwannopathy. Our results showed that TLN increased ATP levels (0.38 of model, 0.69 of HTLN, 0.61 of LTLN, P<0.01; 0.52 of 150 mM glucose, 1.00 of 10% TLN, P<0.01, 0.94 of 1% TLN, P<0.05), MMP (0.56 of 150 mM glucose, P<0.01, 0.75 of 10% TLN, P<0.05, 0.83 of 1% TLN, P<0.01), and mtDNA (0.32 of 150 mM glucose, 0.43 of 10% TLN, P<0.01) while decreased Ca2+ (1.54 of model, 1.06 of HTLN, 0.96 of LTLN, P<0.01) to improve mitochondrial function in vivo and in vitro. TLN helps maintain balance of mitochondrial dynamics: it reduces the mitochondria number (1.60 of 150 mM glucose, 1.10 of 10% TLN, P<0.01) and increases the mitochondria coverage (0.51 of 150 mM glucose, 0.80 of 10% TLN, 0.87 of 1% TLN, P<0.01), mitochondrial network size (0.51 of 150 mM glucose, 0.95 of 10% TLN, 0.94 of 1% TLN, P<0.01), and branch length (0.63 of 150 mM glucose, P<0.01, 0.73 of 10% TLN, P<0.05, 0.78 of 1% TLN, P<0.01). Further, mitochondrial dynamics-related Mfn1 (0.47 of model, 0.82 of HTLN, 0.77 of LTLN, P<0.01; 0.42 of 150 mM glucose, 0.56 of 10% TLN, 0.57 of 1% TLN, P<0.01), Mfn2 (0.40 of model, 0.84 of HTLN, 0.63 of LTLN, P<0.01; 0.46 of 150 mM glucose, 1.40 of 10% TLN, 1.40 of 1% TLN, P<0.01), and Opa1 (0.58 of model, 0.71 of HTLN, 0.90 of LTLN, P<0.01; 0.69 of 150 mM glucose, 0.96 of 10% TLN, 0.98 of 1% TLN, P<0.05) were increased, while Drp1 (1.39 of model, 0.96 of HTLN, 1.18 of LTLN, P<0.01; 1.70 of 150 mM glucose, 1.20 of 10% TLN, 1.10 of 1% TLN, P<0.05), phosphorylated Drp1 (2.61 of model, 1.44 of HTLN, P<0.05; 2.80 of 150 mM glucose, 1.50 of 10% TLN, 1.30 of 1% TLN, P<0.01), and Drp1 located in mitochondria (1.80 of 150 mM glucose, 1.00 of 10% TLN, P<0.05) were decreased after treatment with TLN. Additionally, TLN improved schwannopathy by increasing MBP (0.50 of model, 1.05 of HTLN, 0.94 of HTLN, P<0.01; 0.60 of 150 mM glucose, 0.78 of 10% TLN, P<0.01, 0.72 of 1% TLN, P<0.05), Sox101 (0.41 of model, 0.99 of LTLN, P<0.01; 0.48 of 150 mM glucose, 0.65 of 10% TLN, P<0.05, 0.69 of 1% TLN, P<0.01), and MPZ (0.48 of model, 0.66 of HTLN, 0.55 of HTLN, P<0.01; 0.60 of 150 mM glucose, 0.78 of 10% TLN, P<0.01, 0.75 of 1% TLN, P<0.05) expressions. In conclusion, our study indicated that TLN's function on DPN may link to the improvement of the mitochondrial dynamics, which provides scientific evidence for the clinical application.
Keywords: Drp1; Mfn1; Mfn2; OPA1; Schwann cells; diabetic peripheral neuropathy; mitochondrial dynamics.
Copyright © 2021 Zhu, Yang, Li, Han, Zhu and Xu.
Conflict of interest statement
The authors declare that the research was conducted in the absence of any commercial or financial relationships that could be construed as a potential conflict of interest.
Figures


References
-
- Agarwal N., Taberner F. J., Rangel Rojas D., Moroni M., Omberbasic D., Njoo C., et al. (2020). SUMOylation of Enzymes and Ion Channels in Sensory Neurons Protects against Metabolic Dysfunction, Neuropathy, and Sensory Loss in Diabetes. Neuron 107, 1141–1159. 10.1016/j.neuron.2020.06.037 - DOI - PubMed
LinkOut - more resources
Full Text Sources
Other Literature Sources
Research Materials
Miscellaneous

