. 2021 May 13:12:679741.
doi: 10.3389/fphar.2021.679741. eCollection 2021.

Patient Derived Colonoids as Drug Testing Platforms-Critical Importance of Oxygen Concentration

Affiliations

Patient Derived Colonoids as Drug Testing Platforms-Critical Importance of Oxygen Concentration

Helene Kolstad Skovdahl et al. Front Pharmacol. .

Abstract

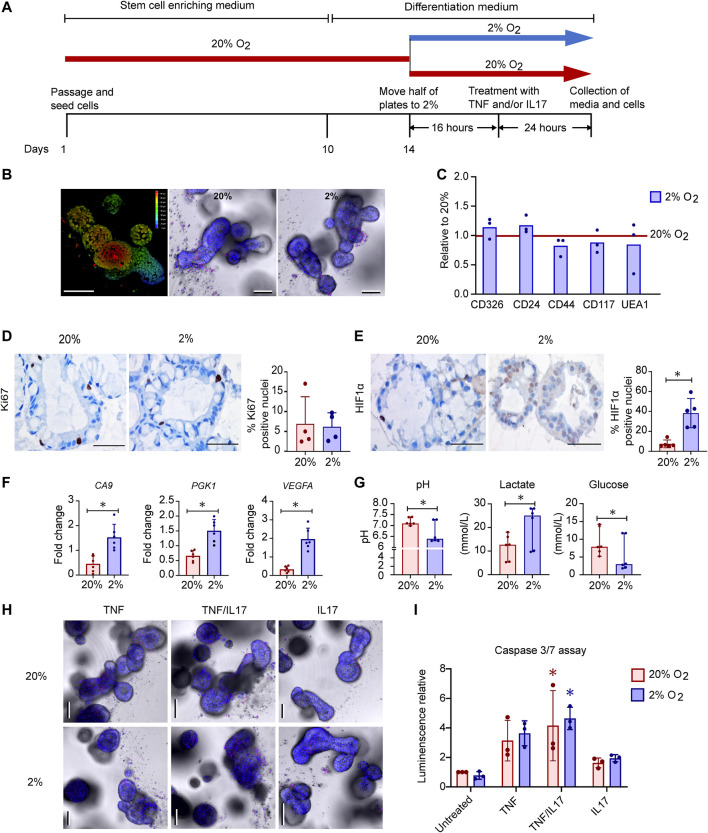
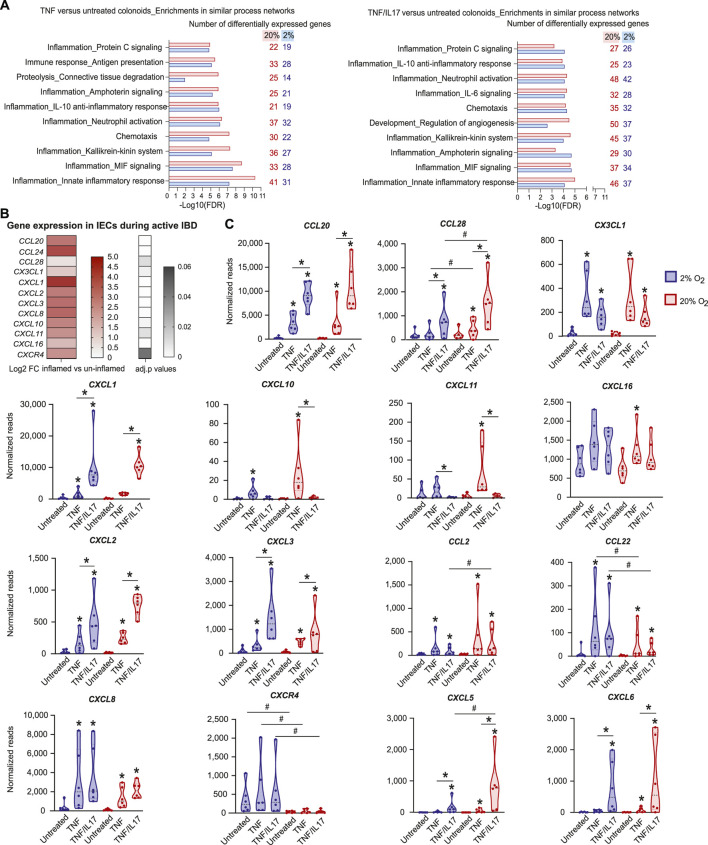
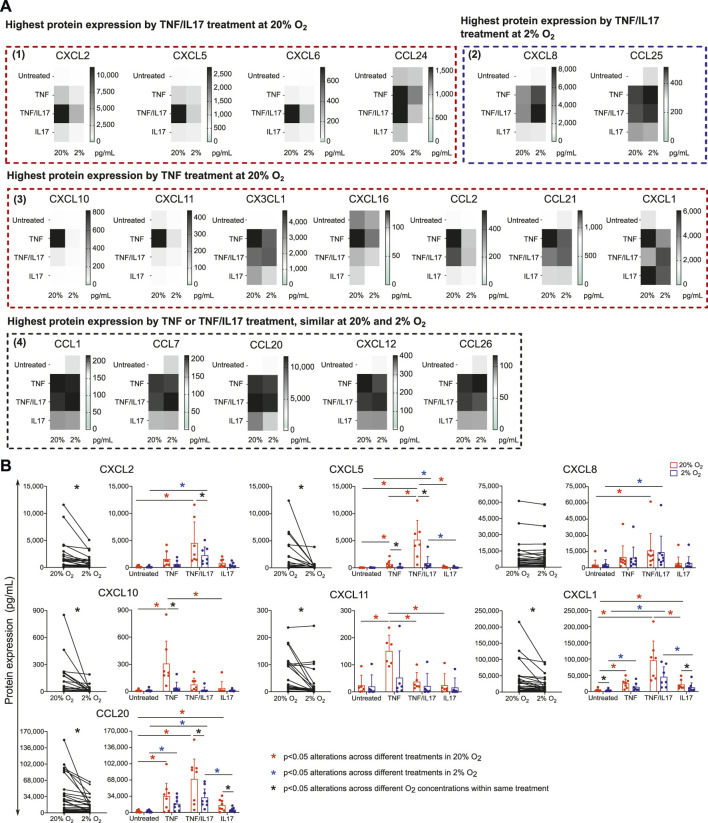
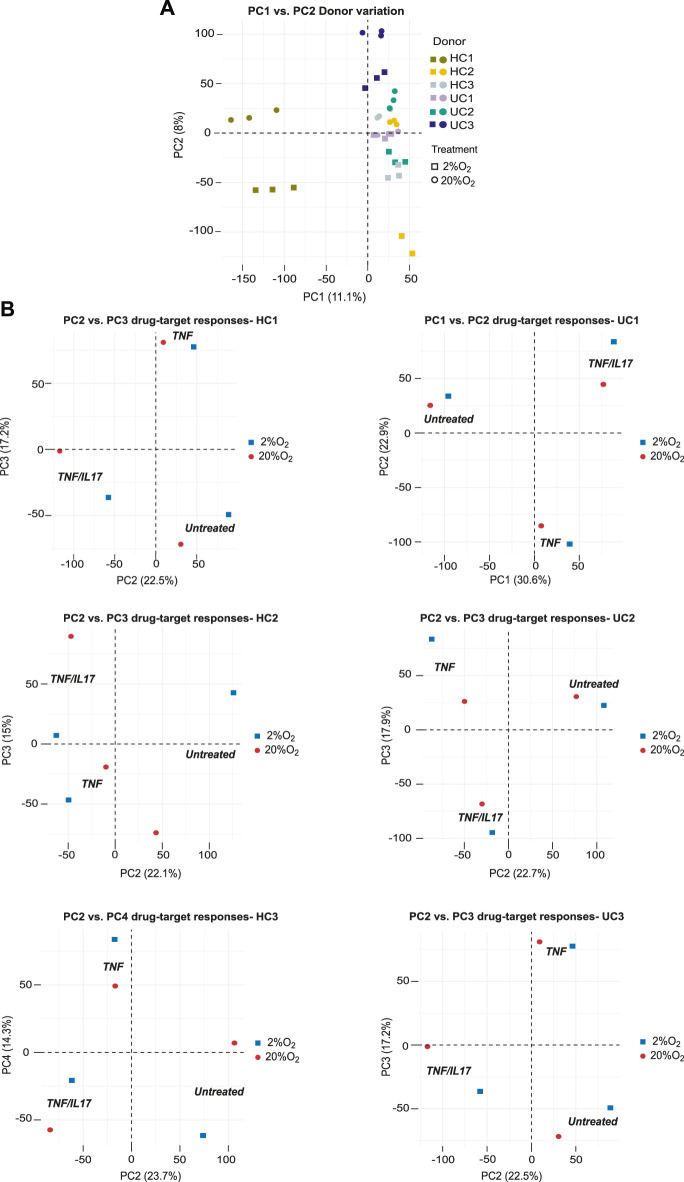
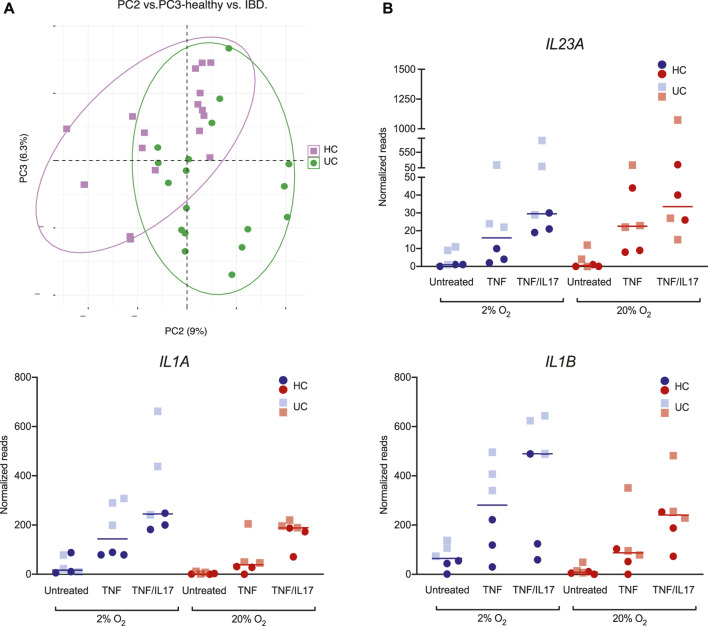
Treatment of inflammatory bowel disease (IBD) is challenging, with a series of available drugs each helping only a fraction of patients. Patients may face time-consuming drug trials while the disease is active, thus there is an unmet need for biomarkers and assays to predict drug effect. It is well known that the intestinal epithelium is an important factor in disease pathogenesis, exhibiting physical, biochemical and immunologic driven barrier dysfunctions. One promising test system to study effects of existing or emerging IBD treatments targeting intestinal epithelial cells (IECs) is intestinal organoids ("mini-guts"). However, the fact that healthy intestinal epithelium is in a physiologically hypoxic state has largely been neglected, and studies with intestinal organoids are mainly performed at oxygen concentration of 20%. We hypothesized that lowering the incubator oxygen level from 20% to 2% would recapitulate better the in vivo physiological environment of colonic epithelial cells and enhance the translational value of intestinal organoids as a drug testing platform. In the present study we examine the effects of the key IBD cytokines and drug targets TNF/IL17 on human colonic organoids (colonoids) under atmospheric (20%) or reduced (2%) O2. We show that colonoids derived from both healthy controls and IBD-patients are viable and responsive to IBD-relevant cytokines at 2% oxygen. Because chemokine release is one of the important immunoregulatory traits of the epithelium that may be fine-tuned by IBD-drugs, we also examined chemokine expression and release at different oxygen concentrations. We show that chemokine responses to TNF/IL17 in organoids display similarities to inflamed epithelium in IBD-patients. However, inflammation-associated genes induced by TNF/IL17 were attenuated at low oxygen concentration. We detected substantial oxygen-dependent differences in gene expression in untreated as well as TNF/IL17 treated colonoids in all donors. Further, for some of the IBD-relevant cytokines differences between colonoids from healthy controls and IBD patients were more pronounced in 2% O2 than 20% O2. Our results strongly indicate that an oxygen concentration similar to the in vivo epithelial cell environment is of essence in experimental pharmacology.

Keywords: cytokines; epithelium; inflammatory bowel diseases; interleukin 17; organoids; oxygen; tumor necrosis factor.


Conflict of interest statement

The authors declare that the research was conducted in the absence of any commercial or financial relationships that could be construed as a potential conflict of interest.

Figures

FIGURE 1
FIGURE 1
Effects of oxygen concentration on growth, cell-death, gene expression and metabolism in human colonoids (A). Experimental design. Differentiated colonoids from six donors were either grown continuously at 20% O2 or calibrated at 2% O2 for 16h before treated with TNF (100ngml−1), IL17 (100ngml−1) or a combination (TNF/IL17) for 24h (B) Detection of morphology and cell death by live imaging of untreated colonoids. Left image shows a 3D depth encoded image of one colonoid at 20% O2, according to the color scale from red (superficial) to blue (deep) on the right side of the image. Center and right image panels show colonoids in 20% or 2% O2 respectively, where NucBlue® Live reagent (Hoechst 33342) stains all cell nuclei (blue) and propidium iodide stains dead cell nuclei (red). Scale bars 100µm (C) Expression of epithelial cell markers as measured by flow cytometry in untreated colonoids from three donors, in 20% O2 or 2% O2 as depicted in panel (A) (n = 3 + 3 for each marker). Relative change between oxygen concentrations normalized to 20% O2 (red line at y = 1) displayed, with mean and individual normalized values (D) and (E) Immunostaining of differentiated colonoids grown at 20% or 2% O2, representative selection from five assays. Scale bars 50µm. (D) Ki67 positive nuclei stained brown, counterstaining with hematoxylin. The graph shows percentage of Ki67 positive nuclei in four independent experiments indicated by dots. Bars show mean with SD (E) HIF1α translocated to nuclei shown in brown counterstaining with hematoxylin. The graph shows percentage of HIF1α positive nuclei in five independent experiments indicated by dots. Bars show mean with SD. *p < 0.05 (Mann-Whitney U test) (F) Expression of the HIF target genes CA9, PGK1 and VEGFA in untreated colonoids (n = 6) at 20% or 2% O2 (n = 6) by RT-qPCR. Mean fold change relative to housekeeping gene (ACTB) with SD and individual values is given. Paired t-tests were used to detect difference between 20 and 2% O2 (*p < 0.05) (G) pH, Lactate (mmol.L−1) and glucose (mmol.L−1) in conditioned medium from untreated colonoids (n = 6) grown at 20% or 2% O2 for 40h. Median with CI and individual values shown. Differences determined using Wilcoxon matched-pairs signed rank test (*p < 0.05) (H) Imaging of colonoids at 20% or 2% O2, after treatment for 24h with TNF or IL17 alone or in combination (TNF/IL17). Staining performed as in (B). Scale bars 100µm (I) caspase 3/7 activity in untreated, TNF, TNF/IL17 or IL17 treated colonoids grown at 20% or 2% O2. Mean luminescence normalized to untreated at 20% O2 and individual values shown from three independent assays. Significant cytokine induced apoptosis determined by Kruskal Wallis test followed by Dunn's multiple comparison test (*p < 0.05). No difference found between oxygen concentrations (paired t-test).
FIGURE 2
FIGURE 2
Effects of TNF and IL17 on inflammation-related genes in colonoids at 20% or 2% O2 (A) Enrichment analysis of RNA-Seq data from colonoids after treatment with TNF or TNF/IL17 compared to untreated control at 20% or 2% O2. Gene ontology (GO) networks strongly associated with the differentially regulated genes (adjusted p values are all <0.05) are shown, with bars illustrating the statistical significance of the association (−Log10 false discovery rate (FDR)). The numbers of genes associated with the GO networks at 20% or 2% O2 are listed on the right. Enrichment analyses were performed using MetaCore™ version 6.34 build 69200 (Supplementary Data Sheet 2) (B) Upregulated chemokine and chemokine receptor genes in microdissected colonic epithelium from active IBD (n = 12) compared to uninflamed epithelium (healthy controls and IBD in remission, n = 17) shown as Log2 fold change (heatmap with upregulated genes) and adjusted p values (gray scale) (C) Chemokine gene expression in colonoids from six donors, treated with TNF or TNF/IL17 for 24h in 2 and 20% O2. Examples of significantly (p < 0.05) regulated chemokines and receptors are shown, determined using LIMMA linear models with least squares regression and empirical Bayes moderated t-statistics with Benjamini Hochberg false discovery rate correction for multiple comparisons (B,C). * without lines show significant alterations due to drug-target treatments when compared to untreated controls whereas * above lines show significant comparisons made between TNF and TNF/IL17. # above lines show significant differences between 2% oxygen and 20% O2 within a specific treatment condition.
FIGURE 3
FIGURE 3
Chemokines released by colonoids at 20 or 2% O2. Conditioned medium from colonoids at 20 or 2% O2, followed by 24h treatment with TNF, IL17 or TNF/IL17, and untreated colonoids were analyzed for chemokine concentration (A) Mean protein concentration (pg.ml−1) of chemokines in conditioned medium from colonoids (n = 3 independent assays) analyzed by Human Chemokine Panel featuring 40 magnetic bead-based immunoassays. The 18 heatmaps show expression of significantly regulated proteins and are grouped according to 1) Highest protein expression by TNF/IL17 treatment at 20% O2. 2) Highest protein expression by TNF/IL17 treatment at 2% O2. 3) Highest protein expression by TNF treatment at 20% O2, and 4) Highest protein expression by TNF or TNF/IL17 treatment, similar at 20 and 2% O2 (B) CCL20, CXCL1, CXCL2, CXCL5, CXCL8, CXCL10 and CXCL11 protein concentrations (pg.ml−1) in conditioned medium from minimum six assays measured by ELISA. Left panels: paired data at 2 or 20% O2 across all treatments for the selected chemokines, analyzed with Wilcoxon matched-pairs signed rank test. Significance level is indicated as p values or not significant (ns). Right panels: concentrations for each chemokine in 2% (blue) or 20% (red) O2 plotted as individual values with mean and SD. Statistical analysis were performed on log2 transformed data (Supplementary Data Sheet 2). Alterations across different treatments within each oxygen concentrations were analyzed with one-way ANOVA followed by Tukey’s multiple comparisons or Kruskal-Wallis test followed by Dunn’s multiple comparisons test. Alterations across different oxygen concentrations within same treatment were analyzed by two-way ANOVA followed by Holm-Šídák multiple comparisons test. *p < 0.05; red and blue asterisks show comparisons across different treatments within 20 and 2% O2 conditions, respectively. Black asterisks indicate significant comparisons between 2 and 20% oxygen concentrations within a specific treatment.
FIGURE 4
FIGURE 4
Donor differences in global gene expression. The panels show unsupervized analysis (PCA) of RNA-Seq data of colonoids from six donors grown continuously at 20% or at 2% O2 for the last 40h (A) PCA of the complete dataset, PC1 vs PC2 captures the influence of donor variations and oxygen level. The different donors and oxygen concentrations are indicated by color coded symbols. Three treatment conditions per donor in each oxygen concentration (n = 6) are shown (B) PCA of data from each donor. Plot of PC2 vs. PC3 captures the effect of treatments in donors HC1-2 and UC2-3, while PC2 vs. PC4 and PC1 vs PC2 captures this effect best for HC3 and UC1, respectively.
FIGURE 5
FIGURE 5
Donor differences in gene expression of IL23, IL1Α and IL1Β (A) PCA of colonoid gene expression in global gene expression data from ulcerative colitis (UC, green) and healthy controls (HC, purple). Plot of PC2 vs PC3 captures the group effect (B) Expression of the IBD-relevant cytokines IL23A, IL1Α and IL1Β in colonoids from HC (circles) and UC (squares), in 20% (red) or 2% (blue) O2 and treatment with TNF, TNF/IL17 or untreated control. Individual values (normalized reads) with median are shown.

Similar articles

Cited by

References

    1. Allaire J. M., Crowley S. M., Law H. T., Chang S.-Y., Ko H.-J., Vallance B. A. (2018). The Intestinal Epithelium: Central Coordinator of Mucosal Immunity. Trends Immunol. 39, 677–696. 10.1016/j.it.2018.04.002 - DOI - PubMed
    1. Amatya N., Garg A. V., Gaffen S. L. (2017). IL-17 Signaling: The Yin and the Yang. Trends Immunol. 38 (5), 310–322. 10.1016/j.it.2017.01.006 - DOI - PMC - PubMed
    1. Arnauts K., Verstockt B., Ramalho A. S., Vermeire S., Verfaillie C., Ferrante M. (2020). Ex Vivo Mimicking of Inflammation in Organoids Derived from Patients with Ulcerative Colitis. Gastroenterology 159 (4), 1564–1567. 10.1053/j.gastro.2020.05.064 - DOI - PubMed
    1. Ben-Horin S., Chowers Y. (2011). Review Article: Loss of Response to Anti-TNF Treatments in Crohn's Disease. Aliment. Pharmacol. Ther. 33 (9), 987–995. 10.1111/j.1365-2036.2011.04612.x - DOI - PubMed
    1. Breese E. J., Michie C. A., Nicholls S. W., Murch S. H., Williams C. B., Domizio P., et al. (1994). Tumor Necrosis Factor α-producing Cells in the Intestinal Mucosa of Children with Inflammatory Bowel Disease. Gastroenterology. 106 (6), 1455–1466. 10.1016/0016-5085(94)90398-0 - DOI - PubMed