

The Relationship Between Lower Respiratory Tract Microbiome and Allergic Respiratory Tract Diseases in Children
- PMID: 34054744
- PMCID: PMC8160472
- DOI: 10.3389/fmicb.2021.630345
The Relationship Between Lower Respiratory Tract Microbiome and Allergic Respiratory Tract Diseases in Children
Abstract
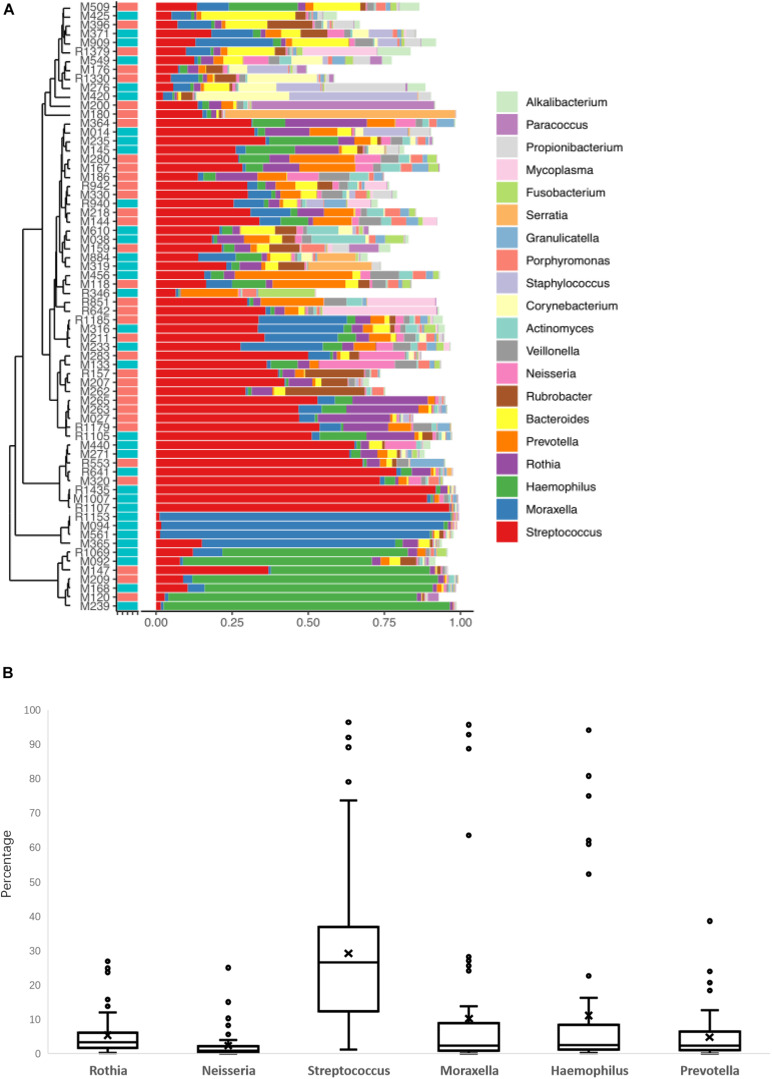
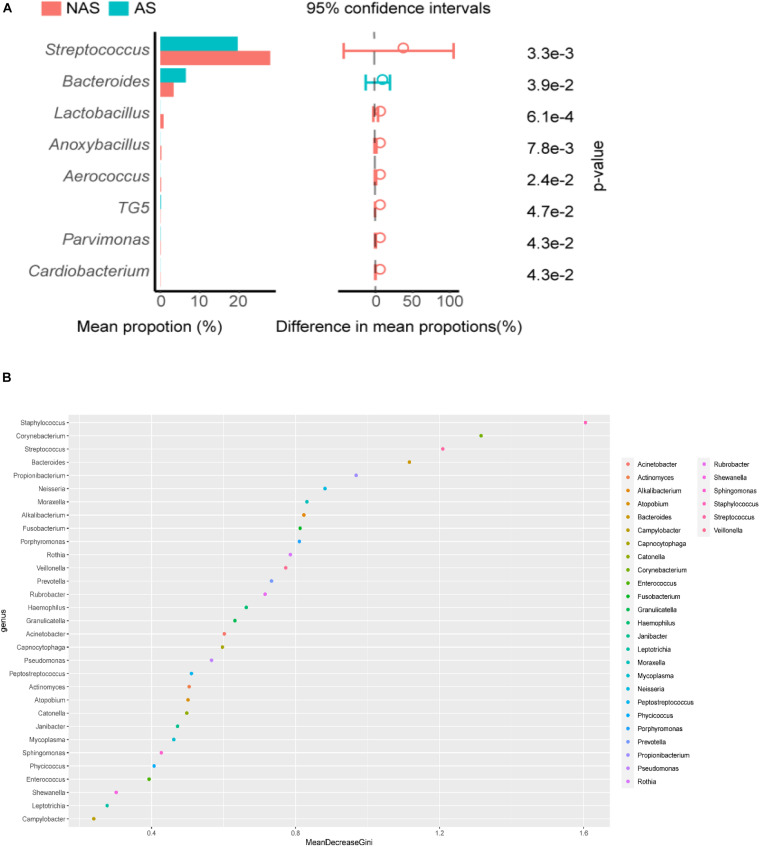
Similar to those in the upper respiratory tract, there are microbes present in the healthy human lower respiratory tract (LRT), including the lungs and bronchus. To evaluate the relationship between LRT microbiome and allergic respiratory diseases in children, we enrolled 68 children who underwent bronchoscopy from January 2018 to December 2018 in the affiliated hospital of the Capital Institute of Pediatrics. Using the total IgE (TIgE) values, children were divided into two groups: allergy sensitivity (AS) group and non-allergy sensitivity (NAS) group. Nucleic acid was extracted from samples of bronchoalveolar lavage fluid (BALF) from the two groups of children taken during bronchoscopy treatment and the 16S rDNA gene was sequenced and analyzed. The results showed that Haemophilus, Moraxella, Streptococcus, Prevotella, Neisseria, and Rothia were detected in all patients. There was a statistically significant difference in the composition and distribution of microbiota between the AS and NAS groups (p < 0.01). Analysis of the correlation of clinical indices and microbiome showed that TIgE was positively correlated with Bacteroidetes and negatively correlated with Streptococcus. Absolute lymphocyte count showed a relationship with Streptococcus, and the absolute neutrophil count or percentage of neutrophils showed a relationship with Cardiobacterium. The LRT microbiome functioned similarly to the intestinal microbiome. That is, the decrease in microbial diversity and the change in composition could lead to an increase in allergic symptoms. The microbiome of the LRT in children, especially that of Bacteriodetes and Streptococcus, showed a correlation with respiratory allergic diseases.
Keywords: allergic respiratory tract diseases; bronchoalveolar lavage fluid; children; lower respiratory tract; microbiome.
Copyright © 2021 Cui, Zhang, Zhao, Sun, Chen, Zhang, Yan, Xue, Li, Feng, Liu, Xie and Yuan.
Conflict of interest statement
The authors declare that the research was conducted in the absence of any commercial or financial relationships that could be construed as a potential conflict of interest. The handling editor declared a shared affiliation with the authors YZ, ZC, QZ at the time of the review.
Figures


References
-
- Bisgaard H., Li N., Bonnelykke K., Chawes B. L., Skov T., Paludan-Müller G., et al. (2011). Reduced diversity of the intestinal microbiota during infancy is associated with increased risk of allergic disease at school age. J. Allergy Clin. Immunol. 128 646–652. 10.1016/j.jaci.2011.04.060 - DOI - PubMed
LinkOut - more resources
Full Text Sources
Other Literature Sources
Research Materials