. 2021 May 14:12:667043.
doi: 10.3389/fmicb.2021.667043. eCollection 2021.

Relative Weight of Organic Waste Origin on Compost and Digestate 16S rRNA Gene Bacterial Profilings and Related Functional Inferences

Affiliations

Relative Weight of Organic Waste Origin on Compost and Digestate 16S rRNA Gene Bacterial Profilings and Related Functional Inferences

Axel Aigle et al. Front Microbiol. .

Abstract

Even though organic waste (OW) recycling via anaerobic digestion (AD) and composting are increasingly used, little is known about the impact of OW origin (fecal matters and food and vegetable wastes) on the end products' bacterial contents. The hypothesis of a predictable bacterial community structure in the end products according to the OW origin was tested. Nine OW treatment plants were selected to assess the genetic structure of bacterial communities found in raw OW according to their content in agricultural and urban wastes and to estimate their modifications through AD and composting. Two main bacterial community structures among raw OWs were observed and matched a differentiation according to the occurrences of urban chemical pollutants. Composting led to similar 16S rRNA gene OTU profiles whatever the OW origin. With a significant shift of about 140 genera (representing 50% of the bacteria), composting was confirmed to largely shape bacterial communities toward similar structures. The enriched taxa were found to be involved in detoxification and bioremediation activities. This process was found to be highly selective and favorable for bacterial specialists. Digestates showed that OTU profiles differentiated into two groups according to their relative content in agricultural (manure) and urban wastes (mainly activated sludge). About one third of the bacterial taxa was significantly affected by AD. In digestates of urban OW, this sorting led to an enrichment of 32 out of the 50 impacted genera, while for those produced from agricultural or mixed urban/agricultural OW (called central OW), a decay of 54 genera over 60 was observed. Bacteria from activated sludge appeared more fit for AD than those of other origins. Functional inferences showed AD enriched genera from all origins to share similar functional traits, e.g., chemoheterotrophy and fermentation, while being often taxonomically distinct. The main functional traits among the dominant genera in activated sludge supported a role in AD. Raw OW content in activated sludge was found to be a critical factor for predicting digestate bacterial contents. Composting generated highly predictable and specialized community patterns whatever the OW origin. AD and composting bacterial changes were driven by functional traits selected by physicochemical factors such as temperature and chemical pollutants.

Keywords: 16S rRNA gene meta-barcoding; anaerobic digestion; composting; functional traits; organic waste.


Conflict of interest statement

The authors declare that the research was conducted in the absence of any commercial or financial relationships that could be construed as a potential conflict of interest.

Figures

FIGURE 1
FIGURE 1
Boxplots showing the relative occurrences of two DNA markers indicative of human and pig fecal contaminations. Datasets are from Supplementary Table 4. Numbers of (A) HF183 and (B) pig-2-bac DNA copies per gram dry weight organic wastes, composts, or digestates normalized to 16S rRNA gene copy numbers were presented according to OW origins (agricultural, urban, and central). Boxplots show the minimum, first quartile (Q1), median, third quartile (Q3), and maximum relative abundances observed among the datasets. Outliers or unexpected values are indicated by dots. Samples used in these analyses are those of Table 1.
FIGURE 2
FIGURE 2
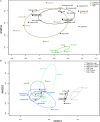
Non-metric multidimensional scaling (NMDS) plot of Bray–Curtis dissimilarities computed from the 16S rRNA V5–V6 OTU profiles (subsampled, 97% identity) of the organic samples before (raw OW) and after treatment by anaerobic digestion or composting. (A) NMDS ordinations were built from the full dataset shown in Table 1; stress value was 0.1227. (B) NMDS ordinations were built from a dataset limited to raw OW and digestates. The ellipses indicate the variance observed within each group of samples. PERMAMOVA tests are indicated in the text and confirmed the significance (p < 0.05) of several groupings.
FIGURE 3
FIGURE 3
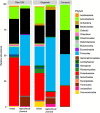
Relative averaged abundances of V5–V6 16S rRNA gene reads allocated to phyla before and after treatment of raw organic wastes (OWs) by anaerobic digestion or composting performed by treatment plants located in rural areas (agricultural/central sites) or urban ones. Only phyla with a relative abundance above 0.5% are displayed (see Supplementary Table 9 for the complete dataset).
FIGURE 4
FIGURE 4
Genera with significant changes in relative abundance after anaerobic digestion of raw organic waste samples from agricultural and central mixed origin. Genera with significant (padj < 0.05) decrease in digestates compared to raw OW samples (left part of the plot) are presented according to their initial relative abundance in raw OW. Genera with significant increase in digestates compared to raw OW samples (right part of the plot) are presented according to their relative abundance in digestate. Genera are colored according to the phylum to which they belong. Full mark represents genus present in the core microbiome; empty mark represents genus not present in the core microbiome (raw OW and digestate core microbiomes were, respectively, considered at the left and right part of the plot). Numbers in brackets represent the sum at the phylum level of relative abundances of all genera with significant change after AD calculated before and after AD (raw OW%/digestate%). Only genera with relative abundance ≥ 0.3% and significant change (-2 ≥ Log2 FC ≥ +2, padj < 0.05, minimum normalized read count = 10) are shown (see Supplementary Table 10 for the other groups).
FIGURE 5
FIGURE 5
Genera with significant change in relative abundance after anaerobic digestion of raw organic wastes samples from urban origin. Genera with significant (padj < 0.05) decrease in digestates compared to raw OW samples (left part of the plot) are presented according to their initial relative abundance in raw OW. While genera with significant increase in digestates compared to raw OW samples (right part of the plot) are presented according to their relative abundance in digestate. Genera are colored according to the phylum to which they belong. Full mark represents genus present in the core microbiome while empty mark represents genus not present in the core microbiome (raw OW and digestate core microbiomes were, respectively, considered at the left and right part of the plot). Numbers in brackets represent the sum at the phylum level of relative abundances of all genera with significant change after AD calculated before and after AD (raw OW%/digestate%). Only genera with relative abundance ≥ 0.3% and significant change (-2 ≥ Log2 FC ≥ +2, padj < 0.05, minimum normalized read count = 10) are shown (see Supplementary Table 11 for the other groups).
FIGURE 6
FIGURE 6
Genera with significant change in relative abundance after composting of organic waste samples. Genera with significant (padj < 0.05) decrease in compost compared to OW samples (left part of the plot) are presented according to their initial relative abundance in OW, while genera with a significant increase in compost compared to OW samples (right part of the plot) are presented according to their relative abundance in compost. Genera are colored according to the phylum to which they belong. Full mark represents genus present in the core microbiome; empty mark represents genus not present in the core microbiome (OW and compost core microbiomes were, respectively, considered at the left and right part of the plot). Numbers in brackets represent the sum at the phylum level of relative abundance of all genera with significant change after composting calculated before and after composting (OW%/Compost%). Only genera with relative abundance ≥ 0.3% and significant change (-2 ≥ Log2 FC ≥ +2, padj < 0.05, minimum normalized read count = 10) are shown (see Supplementary Table 12 for the other groups).

Similar articles

Cited by

References

    1. Abendroth C., Vilanova C., Günther T., Luschnig O., Porcar M. (2015). Eubacteria and archaea communities in seven mesophile anaerobic digester plants in Germany. Biotechnol. Biofuels 8:87. 10.1186/s13068-015-0271-6 - DOI - PMC - PubMed
    1. Ahmad R., Jilani G., Arshad M., Zahir Z. A., Khalid A. (2007). Bio-conversion of organic wastes for their recycling in agriculture: an overview of perspectives and prospects. Ann. Microbiol. 57 471–479. 10.1007/BF03175343 - DOI
    1. Anders S., Huber W. (2010). Differential expression analysis for sequence count data. Genome Biol. 11:R106. - PMC - PubMed
    1. Anukam A., Mohammadi A., Naqvi M., Granström K. (2019). A review of the chemistry of anaerobic digestion: methods of accelerating and optimizing process efficiency. Processes 7:504. 10.3390/pr7080504 - DOI
    1. Atelge M. R., Krisa D., Kumar G., Eskicioglu C., Nguyen D. D., Chang S. W., et al. (2020). Biogas production from organic waste: recent progress and perspectives. Waste Biomass Valorization 11 1019–1040. 10.1007/s12649-018-00546-0 - DOI

LinkOut - more resources