Comparative Study
. 2021 May 12:12:628504.
doi: 10.3389/fimmu.2021.628504. eCollection 2021.

Differences in Maturation Status and Immune Phenotypes of Circulating Helios+ and Helios- Tregs and Their Disrupted Correlations With Monocyte Subsets in Autoantibody-Positive T1D Individuals

Affiliations
Comparative Study

Differences in Maturation Status and Immune Phenotypes of Circulating Helios+ and Helios- Tregs and Their Disrupted Correlations With Monocyte Subsets in Autoantibody-Positive T1D Individuals

Yuyue Zhang et al. Front Immunol. .

Abstract

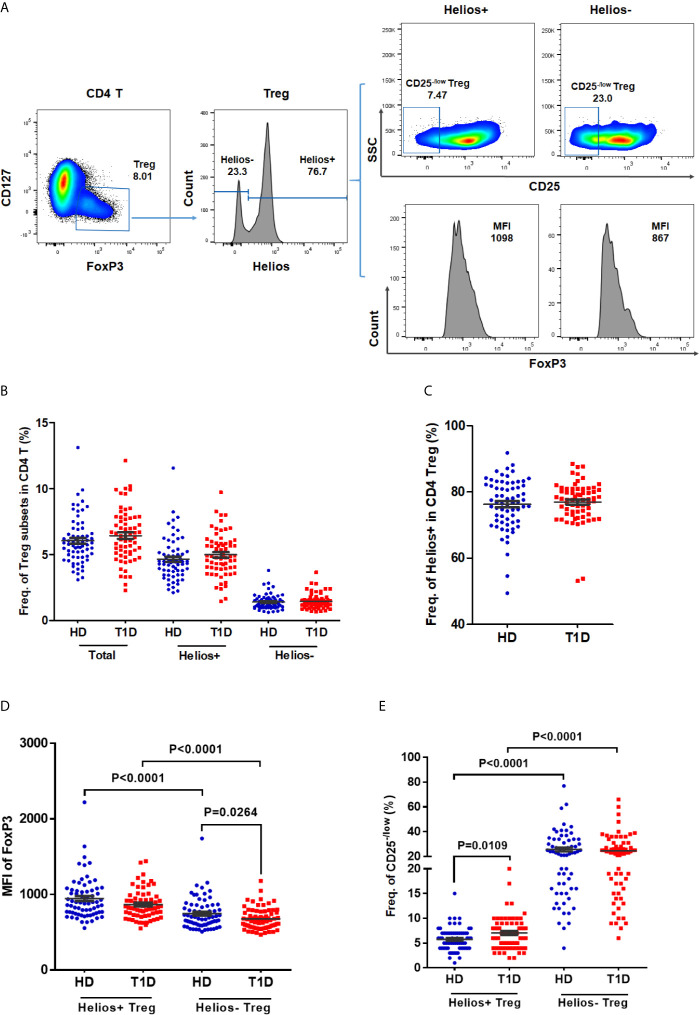
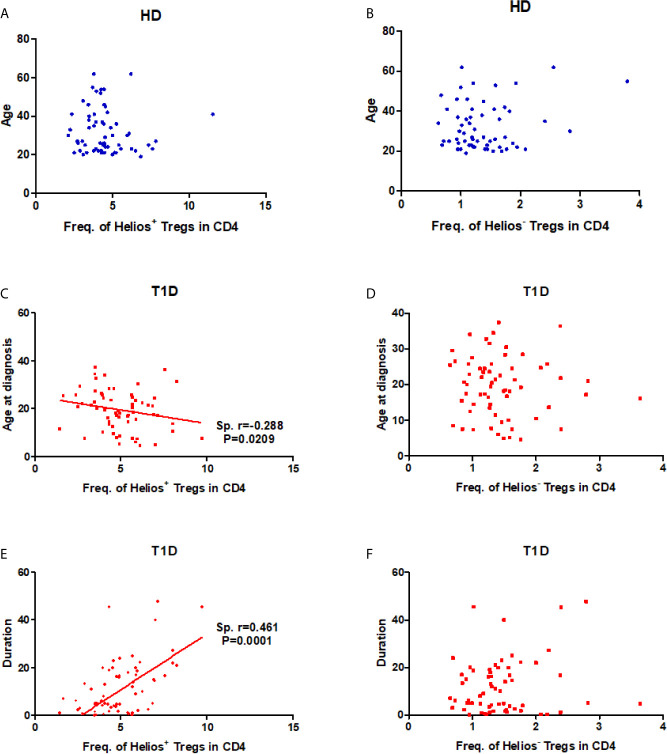
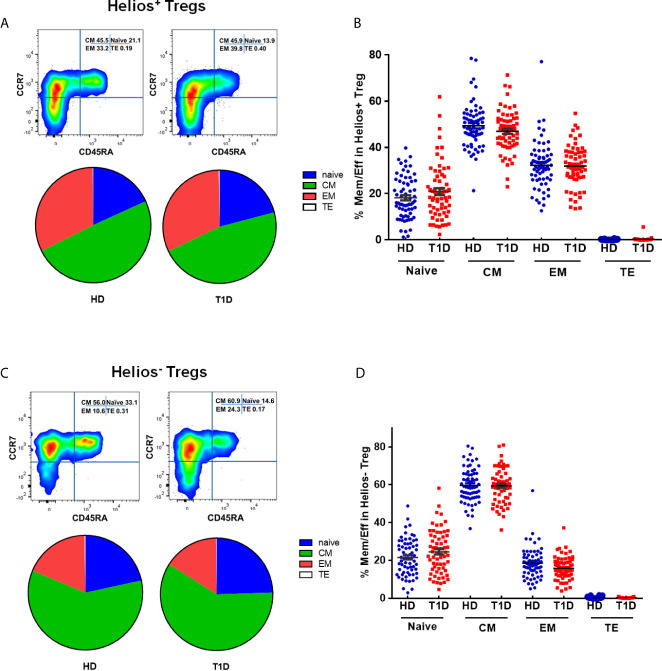
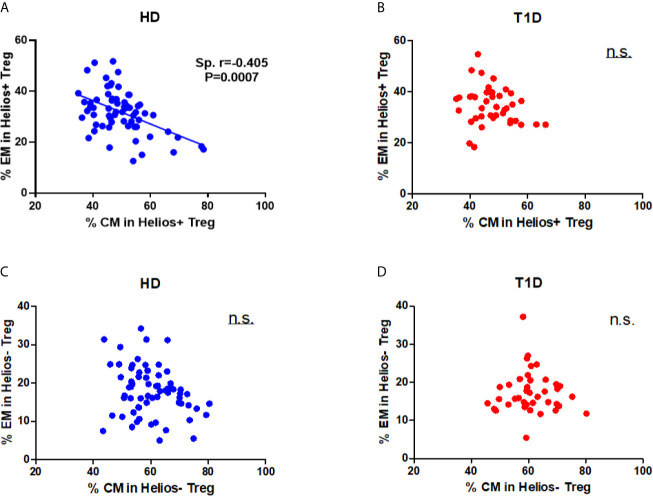
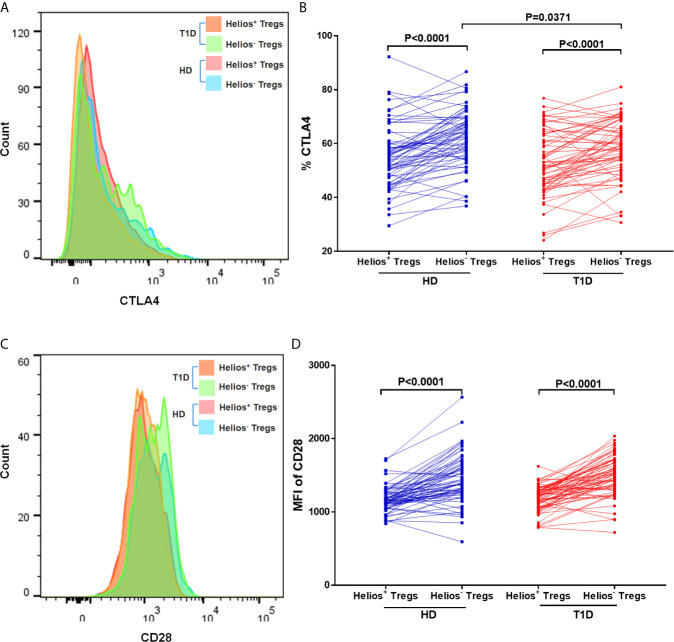
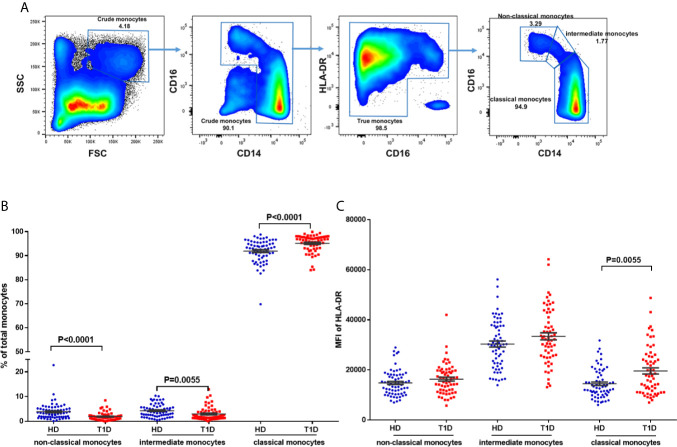
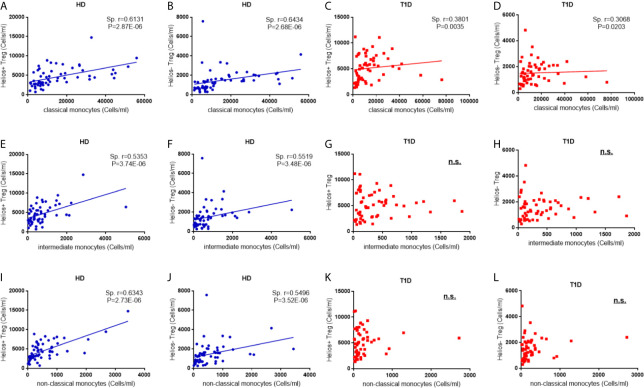
CD4 Tregs are involved in the regulation of various autoimmune diseases but believed to be highly heterogeneous. Studies have indicated that Helios controls a distinct subset of functional Tregs. However, the immunological changes in circulating Helios+ and Helios- Tregs are not fully explored in type 1 diabetes (T1D). Here, we elucidated the differences in maturation status and immune regulatory phenotypes of Helios+ and Helios- Tregs and their correlations with monocyte subsets in T1D individuals. As CD25-/low FOXP3+ Tregs also represent a subset of functional Tregs, we defined Tregs as FOXP3+CD127-/low and examined circulating Helios+ and Helios- Treg subpopulations in 68 autoantibody-positive T1D individuals and 68 age-matched healthy controls. We found that expression of both FOXP3 and CTLA4 diminished in Helios- Tregs, while the proportion of CD25-/low Tregs increased in Helios+ Tregs of T1D individuals. Although the frequencies of neither Helios+ nor Helios- Tregs were affected by investigated T1D genetic risk loci, Helios+ Tregs correlated with age at T1D diagnosis negatively and disease duration positively. Moreover, the negative correlation between central and effector memory proportions of Helios+ Tregs in healthy controls was disrupted in T1D individuals. Finally, regulatory non-classical and intermediate monocytes also decreased in T1D individuals, and positive correlations between these regulatory monocytes and Helios+/Helios- Treg subsets in healthy controls disappeared in T1D individuals. In conclusion, we demonstrated the alternations in maturation status and immune phenotypes in Helios+ and Helios- Treg subsets and revealed the missing association between these Treg subsets and monocyte subsets in T1D individuals, which might point out another option for elucidating T1D mechanisms.

Keywords: Helios; Tregs; monocytes; regulatory; type 1 diabetes.


Conflict of interest statement

The authors declare that the research was conducted in the absence of any commercial or financial relationships that could be construed as a potential conflict of interest.

Figures

Figure 1
Figure 1
The frequencies of Helios+ and Helios Treg subsets and their expression of FoxP3 and proportions of CD25− /low Tregs in T1D individuals, compared to healthy controls. (A) A representative dot plot for gating CD25 and FoxP3 expression in Helios+ and Helios Treg subsets of a healthy donor. (B) Evaluation of the percentage of total, Helios+ and Helios Tregs in CD4 T cells between T1D and healthy controls. (C) Evaluation of the percentage of Helios+ and Helios Tregs in total Tregs between T1D and healthy controls. (D) Differences in mean fluorescence intensity (MFI) of FoxP3 in Helios+ and Helios Tregs of T1D and healthy controls. MFI of FoxP3 was measured to compare the level of expression of this molecule. (E) Differences in frequency of CD25−/low in Helios+ and Helios Tregs of T1D and healthy controls. HD, healthy controls. Wilcoxon test was used for statistical comparison between the two different subsets. The results were from 68 autoantibody-positive T1D individuals and 68 age-matched autoantibody-negative healthy controls. Samples from T1D individuals and healthy controls were randomly divided to each independent experiment. One biological sample (from the same healthy donor and drawn at the same time) was performed as control for the experimental reproducibility. Comparisons between T1D and healthy controls were performed by unpaired t test with Welch’s correction. A p value below 0.05 indicates a significant difference between groups.
Figure 2
Figure 2
Correlation between frequency of Helios+ or Helios Tregs in CD4 T cells and age at time of blood donation and T1D disease status. (A, B) Correlation between frequency of Helios+ or Helios Tregs in CD4 T cells and age at time of blood donation in healthy controls respectively. (C, D) Correlation between frequency of Helios+ or Helios Tregs in CD4 T cells and age at T1D diagnosis in T1D individuals respectively. (E, F) Correlation between frequency of Helios+ or Helios Tregs in CD4 T cells and T1D duration in T1D individuals respectively. HD, healthy controls. The results were from 68 healthy controls and 68 autoantibody-positive T1D individuals. Samples from T1D individuals and healthy controls were randomly divided to each independent experiment. One biological sample (from the same healthy donor and drawn at the same time) was performed as control for the experimental reproducibility. Spearman correlation was performed for these correlations. A p value below 0.05 indicates a significant difference between groups.
Figure 3
Figure 3
Similar maturation status of both Helios+ and Helios Tregs in T1D individuals, compared with healthy donors (HD). The expression of CD45RA and CCR7 on CD4+ T cells from T1D and HD was analyzed by flow cytometry. (A, C) Pie charts summarize the data and each slice corresponds to the mean proportion of Helios+ and Helios Tregs for each phenotype. (B, D) Possible phenotypes are shown on the x-axis, whereas percentages of distinct T-cell subsets within Helios+ and Helios Tregs are shown on the y-axis. Each point represents a single individual. The results were from 68 autoantibody-positive T1D individuals and 68 age-matched autoantibody-negative healthy controls. Samples from T1D individuals and healthy controls were randomly divided to each independent experiment. One biological sample (from the same healthy donor and drawn at the same time) was performed as control for the experimental reproducibility. Comparisons between phenotype distributions were performed using the partial permutation test, and unpaired t test with Welch’s correction for each phenotype. A p value below 0.05 indicates a significant difference between groups.
Figure 4
Figure 4
A distinct effector/memory differentiation path occurs in Helios+ Tregs from T1D individuals. Correlation analysis between the percentages of CM and EM Treg subsets (Helios+ or Helios) from healthy donors (HD) (A, C) and T1D (B, D) individuals. Spearman rank test was used for the evaluation of the correlation. The results were from 68 healthy controls and 40 autoantibody-positive T1D individuals. Samples from T1D individuals and healthy controls were randomly divided to each independent experiment. One biological sample (from the same healthy donor and drawn at the same time) was performed as control for the experimental reproducibility. Spearman correlation was performed for these correlations. A p value <0.05 was considered as significant. ns, not significant.
Figure 5
Figure 5
Helios+ Tregs differ in CTLA4 and CD28 expression levels with Helios Tregs. Comparison of CTLA4 (A, B) and CD28 (C, D) expression between Helios+ Tregs and Helios Tregs from T1D individuals and healthy donors (HD). Wilcoxon rank test was used for paired statistical analysis. The results were from 68 autoantibody-positive T1D individuals and 68 age-matched autoantibody-negative healthy controls. Samples from T1D individuals and healthy controls were randomly divided to each independent experiment. One biological sample (from the same healthy donor and drawn at the same time) was performed as control for the experimental reproducibility. Comparisons between T1D and healthy controls were performed by unpaired t test with Welch’s correction. A p value <0.05 was considered as significant.
Figure 6
Figure 6
Differences in HLA-DR expression and distribution in circulating monocyte subsets and in T1D compared to age-matched healthy donors (HD). (A) Gating strategy for the determination of peripheral monocyte subsets by flow cytometry with the combination of CD14, CD16 and HLA-DR. Three monocyte subsets were defined: non-classical monocytes (CD14+CD16++), intermediate monocytes (CD14++CD16++), and classical monocytes (CD14++CD16+). (B) Distribution of monocyte subsets in T1D cases compared to age-matched healthy donors (HD). (C) HLA-DR expression in different monocyte subsets of T1D cases compared to age-matched healthy donors (HD). The results were from 68 autoantibody-positive T1D individuals and 68 age-matched autoantibody-negative healthy controls. Samples from T1D individuals and healthy controls were randomly divided to each independent experiment. One biological sample (from the same healthy donor and drawn at the same time) was performed as control for the experimental reproducibility. Comparisons between T1D and healthy controls were performed by unpaired t test with Welch’s correction. A p value <0.05 was considered as significant.
Figure 7
Figure 7
Correlations between regulatory monocytes and Helios+ and Helios Treg subsets in T1D individuals. Correlation analysis between classical, intermediate and classical monocytes and Treg subsets from healthy donors (HD) (A, B, E, F, I, J) and T1D individuals (C, D, G, H, K, L). Spearman rank test was used for the evaluation of the correlation. The results were from 68 autoantibody-positive T1D individuals and 68 age-matched autoantibody-negative healthy controls. Samples from T1D individuals and healthy controls were randomly divided to each independent experiment. One biological sample (from the same healthy donor and drawn at the same time) was performed as control for the experimental reproducibility. Spearman correlation was performed for these correlations. A p value <0.05 was considered as significant. ns, not significant.

Similar articles

Cited by

References

    1. Josefowicz SZ, Lu LF, Rudensky AY. Regulatory T Cells: Mechanisms of Differentiation and Function. Annu Rev Immunol (2012) 30:531–64. 10.1146/annurev.immunol.25.022106.141623 - DOI - PMC - PubMed
    1. Grant CR, Liberal R, Mieli-Vergani G, Vergani D, Longhi MS. Regulatory T-cells in Autoimmune Diseases: Challenges, Controversies and–Yet–Unanswered Questions. Autoimmun Rev (2015) 14:105–16. 10.1016/j.autrev.2014.10.012 - DOI - PubMed
    1. Fontenot JD, Gavin MA, Rudensky AY. Foxp3 Programs the Development and Function of CD4+CD25+ Regulatory T Cells. Nat Immunol (2003) 4:330–6. 10.1038/ni904 - DOI - PubMed
    1. Hori S, Nomura T, Sakaguchi S. Control of Regulatory T Cell Development by the Transcription Factor Foxp3. Science (2003) 299:1057–61. 10.1126/science.1079490 - DOI - PubMed
    1. Sakaguchi S, Miyara M, Costantino CM, Hafler DA. FOXP3+ Regulatory T Cells in the Human Immune System. Nat Rev Immunol (2010) 10:490–500. 10.1038/nri2785 - DOI - PubMed

Publication types

MeSH terms