. 2021 May 13:12:651033.
doi: 10.3389/fimmu.2021.651033. eCollection 2021.

Immune Landscape of Gastric Carcinoma Tumor Microenvironment Identifies a Peritoneal Relapse Relevant Immune Signature

Affiliations

Immune Landscape of Gastric Carcinoma Tumor Microenvironment Identifies a Peritoneal Relapse Relevant Immune Signature

Chuang Zhang et al. Front Immunol. .

Abstract

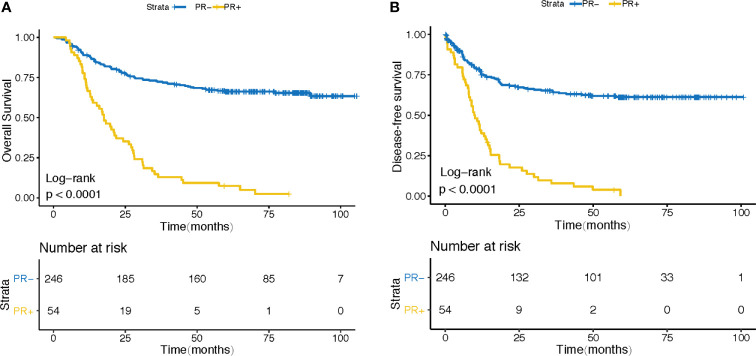
Background: Gastric cancer (GC) still represents the third leading cause of cancer-related death worldwide. Peritoneal relapse (PR) is the most frequent metastasis occurring among patients with advanced gastric cancer. Increasingly more evidence have clarified the tumor immune microenvironment (TIME) may predict survival and have clinical significance in GC. However, tumor-transcriptomics based immune signatures derived from immune profiling have not been established for predicting the peritoneal recurrence of the advanced GC.

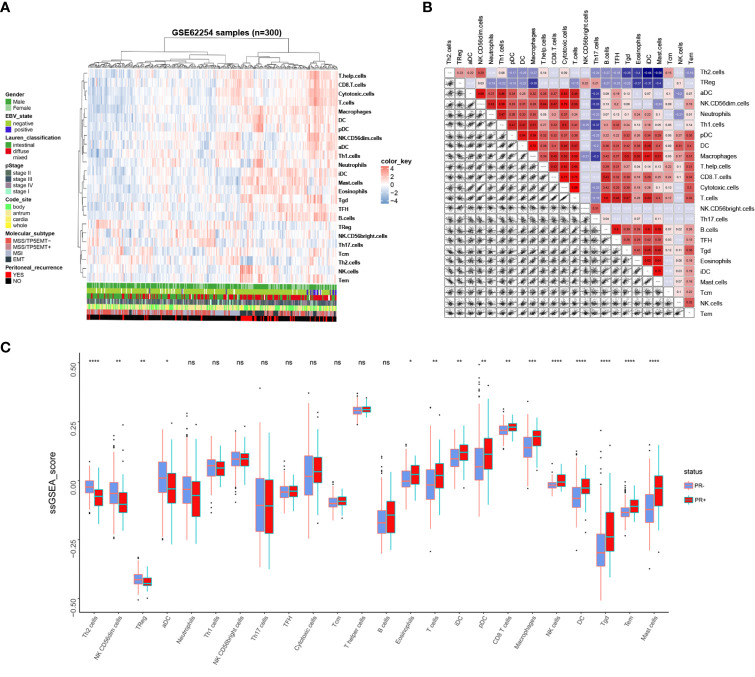
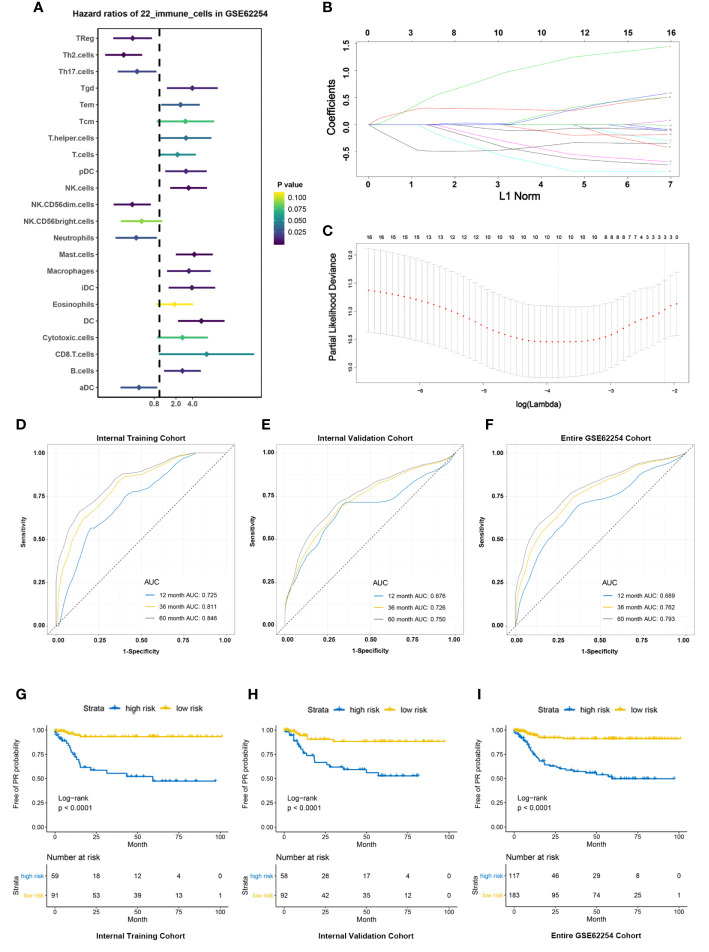
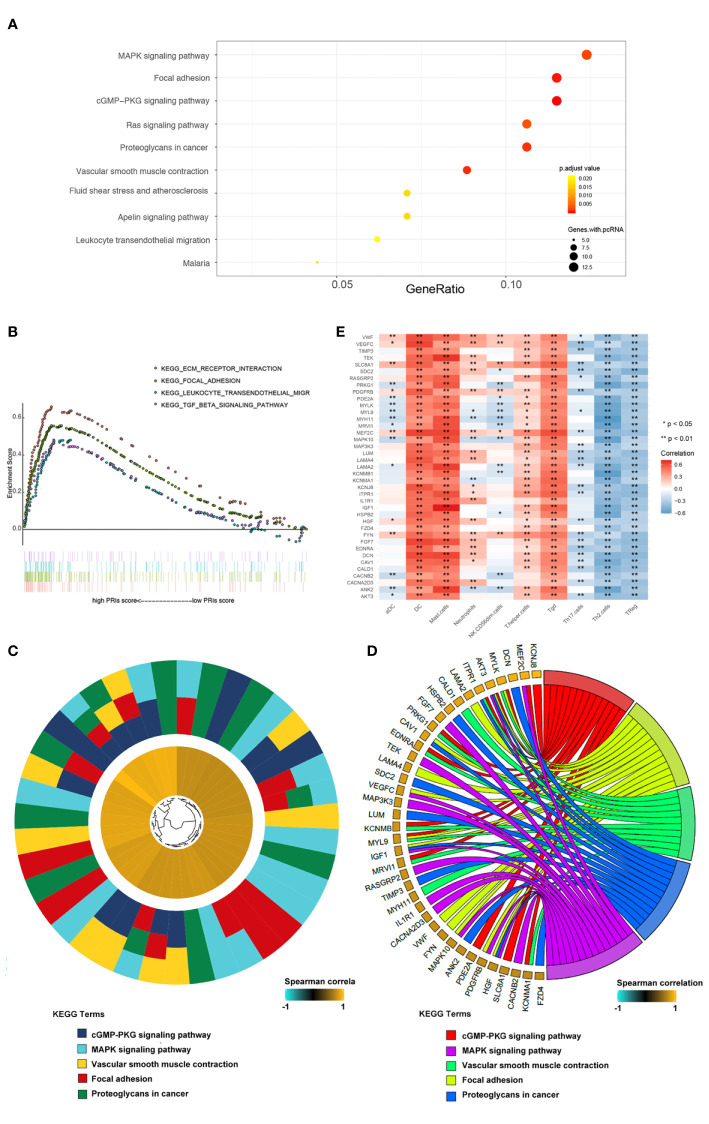
Methods: In this study, we depict the immune landscape of GC by using transcriptome profiling and clinical characteristics retrieved from GSE62254 of Gene Expression Omnibus (GEO). Immune cell infiltration score was evaluated via single-sample gene set enrichment (ssGSEA) analysis algorithm. The least absolute shrinkage and selection operator (LASSO) Cox regression algorithm was used to select the valuable immune cells and construct the final model for the prediction of PR. The receiver operating characteristic (ROC) curve and the Kaplan-Meier curve were used to check the accuracy of PRIs. Gene Set Enrichment Analysis (GSEA) and Kyoto Encyclopedia of Genes and Genomes (KEGG) analysis were performed to explore the molecular pathways associated with PRIs.

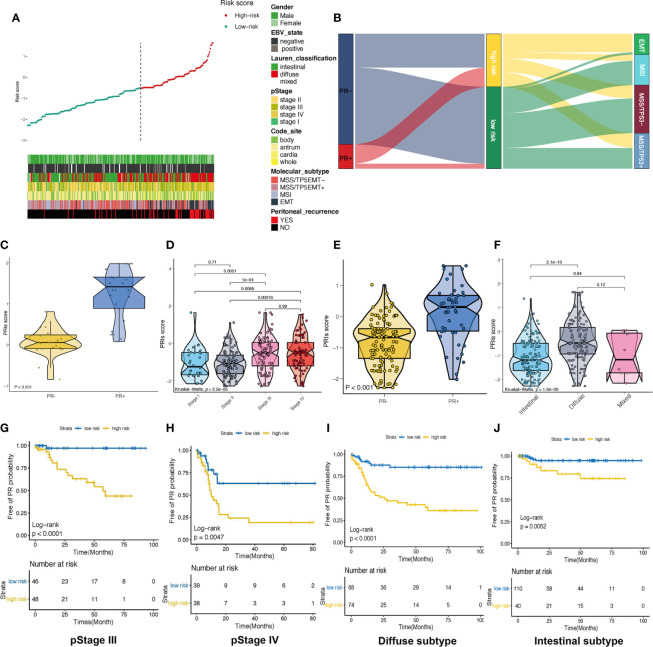
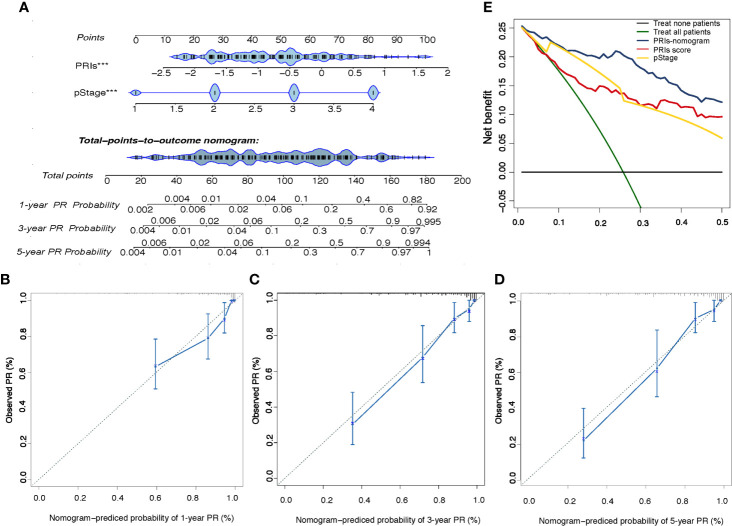
Results: A peritoneal recurrence related immune score (PRIs) with 10 immune cells was constructed. Compared to the low-PRIs group, the high-PRIs group had a greater risk. The upregulation of the focal adhesion signaling was observed in the high-PRIs subtype by GSEA and KEGG. Multivariate analysis found that both in the internal training cohort and the internal validation cohort, PRIs was a stable and independent predictor for PR. A nomogram that integrated clinicopathological features and PRIs to predict peritoneal relapse was constructed. Subgroup analysis indicated that the PRIs could obviously distinguish peritoneal recurrence in different molecular subtypes, pathological stages and Lauren subtypes, in which PRIs of Epithelial-Mesenchymal Transitions (EMT) subtype, III-IV stage and diffuse subtype are higher respectively.

Conclusion: Overall, we performed a comprehensive evaluation of the immune landscape of GC and constructed a predictive PR model based on the immune cell infiltration. The PRIs represents novel promising feature of predicting peritoneal recurrence of GC and sheds light on the improvement of the personalized management of GC patients after surgery.

Keywords: LASSO; TME; gastric cancer; immune signature; peritoneal relapse.


Conflict of interest statement

The authors declare that the research was conducted in the absence of any commercial or financial relationships that could be construed as a potential conflict of interest.

Figures

Figure 1
Figure 1
Association between PR status and patients’ outcomes. (A) for OS and (B) for PFS.
Figure 2
Figure 2
Immune landscape of GC and the TME characteristics. (A) Unsupervised clustering of GC patients from the GSE62254 using ssGSEA score calculated from immune cells. (B) Correlation of the TME immune cells. (C) The Relative immune infiltration score of 24 immune cells between PR- and PR+ gastric tissues. *P < 0.05, **P < 0.01, ***P < 0.001, ****P < 0.0001, ns: no significance.
Figure 3
Figure 3
Construction and validation of PRIs signature. (A) Forest plots showing associations between different immune cells and PR risk in the training cohort. (B) LASSO coefficient profiles of the fractions of immune cells. (C) Parameter selection for tuning by 10-fold cross validation in the LASSO model. (D–F). PRIs measured by time-dependent receiver–operating characteristic (ROC) curves in the training cohort, validation cohort, entire cohort at 1, 3 and 5 years respectively. (G–I) KM-curve for patients with high and low PRIs in the training cohort, validation cohort, entire cohort respectively.
Figure 4
Figure 4
Association between PRIs and clinicopathological parameters (A) Summarizing the distribution of PRIs, and clinical characteristics. (B) Alluvial diagram of PR status in groups with different ACRG subtypes and PRIs. (C) Box diagram of PRIs in PR+ and PR- crowd in patients with EMT molecular subtypes. (D) Box diagram of PRIs with different pStage groups. (E) Box diagram for the differences in PRIs among PR+ and PR- people in pStage III and IV. (F) Differences in PRIs among PR+ and PR- people with different lauren types. (G) KM-curve for patients with high and low PRIs in stage III. (H) KM-curve for patients with high and low PRIs in stage IV. (I) KM-curve for patients with high and low PRIs in diffuse subtype. (J) KM-curve for patients with high and low PRIs in intestinal subtype.
Figure 5
Figure 5
Pathway enrichment analysis based on PRIs. (A) Genes with spearman correlation for PRIs greater than 0.5 were used for KEGG analysis. These genes enriched in KEGG pathways “MAPK signaling pathway,” “Focal adhesion,” “cGMP-PKG signaling pathway,” and “Fas signaling pathway,” etc. Fold enrichment of each KEGG term is indicated by the x-axis and bar color. (B) GSEA terms that are significantly enriched in GSE62254 cohort. “KEGG_ECM_RECEPTOR_INTERACTION”,”KEGG_FOCAL_ADHESION”, “KEGG_LEUKOCYTE_TRANSENDOTHELIAL_MIGRATION”, “KEGG_MISMATCH_REPAIR”,”KEGG_NOTCH_SIGNALING_PATHWAY,” and “KEGG_TGB_BETA_SIGNALING_PATHWAY” was significantly enriched. (C) Hierarchical clustering of gene expression profiles of each KEGG pathways. (D) Chord plots show the relationship between genes and the KEGG pathways. (E) Correlation between the PR-related immune cells and genes in the KEGG pathways. *P < 0.05, **P < 0.01.
Figure 6
Figure 6
Development and Validation of the PRIs-related Nomogram (A) The peritoneal relapse related nomogram based on two predictors include PRIs and pStage. Each factor corresponds to its own score, and each score is added to obtain a total score. The total scores in 1-year, 3-year, 5-year PR probability represent the peritoneal relapse possibility within 1-year, 3-year and 5-year. (B–D) Calibration curve at the year of 1,3,5. The calibration curve describes the calibration of the fitting model according to the consistency between the predicted peritoneal relapse risk and the actual observations. The X axis represents the predicted peritoneal relapse risk, and the y axis represents the actual peritoneal relapse rate. Solid blue lines indicate the performance of nomogram. (E) Decision curve analysis for the PRIs-related nomogram. The Y axis measures net benefit. The blue line, yellow line, red line represent the PRIs-nomogram, pStage and PRIs separately, green line represents the assumption that all patients occurred peritoneal relapse, and the black line at the bottom represents the assumption that no patient occurred peritoneal relapse. The proportion of all false positive patients was subtracted from the proportion of true positive patients, and the net benefit was calculated by weighting the relative harm of abandoning treatment and the negative consequences of unnecessary treatment. Relative damage is calculated in terms of Pt/(1-Pt). Pt means that the expected benefit of treatment is equal to the expected benefit of avoiding treatment, at this point, the patient will choose treatment. The decision curve shows that even if the threshold probability of the patient or doctor is really small, using the PRIs nomogram in this study to predict peritoneal relapse brings more benefits than other methods.

Similar articles

Cited by

References

    1. Bray F, Ferlay J, Soerjomataram I, Siegel RL, Torre LA, Jemal A. Global Cancer Statistics 2018: GLOBOCAN Estimates of Incidence and Mortality Worldwide for 36 Cancers in 185 Countries. Ca-Cancer J Clin (2018) 68(6):394–424. 10.3322/caac.21492 - DOI - PubMed
    1. Yoo CH, Noh SH, Shin DW, Choi SH, Min JS. Recurrence Following Curative Resection for Gastric Carcinoma. Br J Surg (2000) 87(2):236–42. 10.1046/j.1365-2168.2000.01360.x - DOI - PubMed
    1. Abe S, Yoshimura H, Tabara H, Tachibana M, Monden N, Nakamura T, et al. . Curative Resection of Gastric Cancer: Limitation of Peritoneal Lavage Cytology in Predicting the Outcome. J Surg Oncol (1995) 59(4):226–9. 10.1002/jso.2930590405 - DOI - PubMed
    1. Bonnot PE, Piessen G, Kepenekian V, Decullier E, Pocard M, Meunier B, et al. . Cytoreductive Surgery With or Without Hyperthermic Intraperitoneal Chemotherapy for Gastric Cancer With Peritoneal Metastases (Cyto-CHIP Study): A Propensity Score Analysis. J Clin Oncol (2019) 37(23):2028–40. 10.1200/JCO.18.01688 - DOI - PubMed
    1. Yang XJ, Huang CQ, Suo T, Mei LJ, Yang GL, Cheng FL, et al. . Cytoreductive Surgery and Hyperthermic Intraperitoneal Chemotherapy Improves Survival of Patients With Peritoneal Carcinomatosis From Gastric Cancer: Final Results of a Phase III Randomized Clinical Trial. Ann Surg Oncol (2011) 18(6):1575–81. 10.1245/s10434-011-1631-5 - DOI - PMC - PubMed

Publication types

MeSH terms