

A Small Molecule Antagonist of PD-1/PD-L1 Interactions Acts as an Immune Checkpoint Inhibitor for NSCLC and Melanoma Immunotherapy
- PMID: 34054817
- PMCID: PMC8160380
- DOI: 10.3389/fimmu.2021.654463
A Small Molecule Antagonist of PD-1/PD-L1 Interactions Acts as an Immune Checkpoint Inhibitor for NSCLC and Melanoma Immunotherapy
Abstract
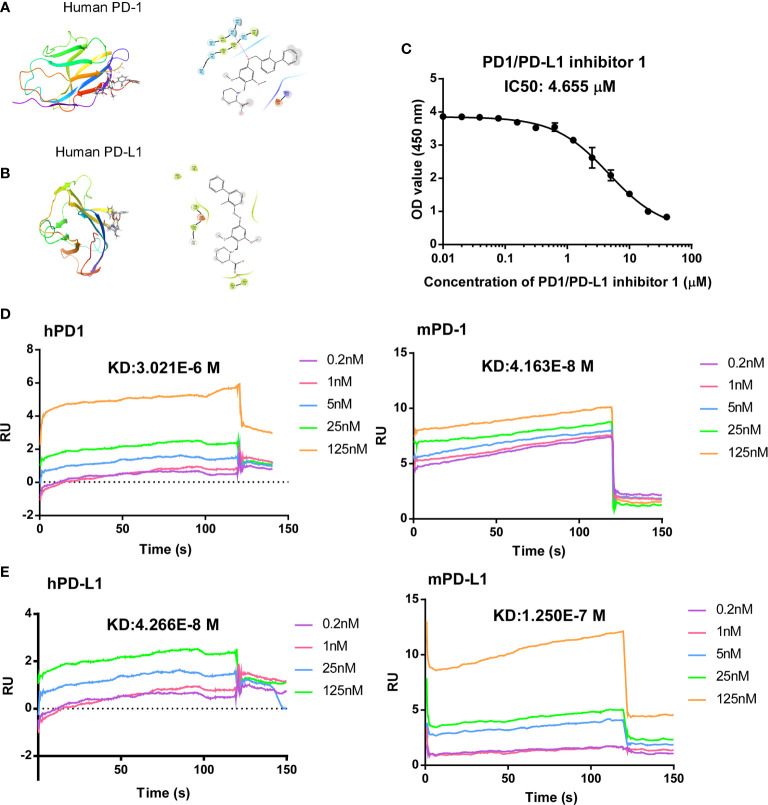
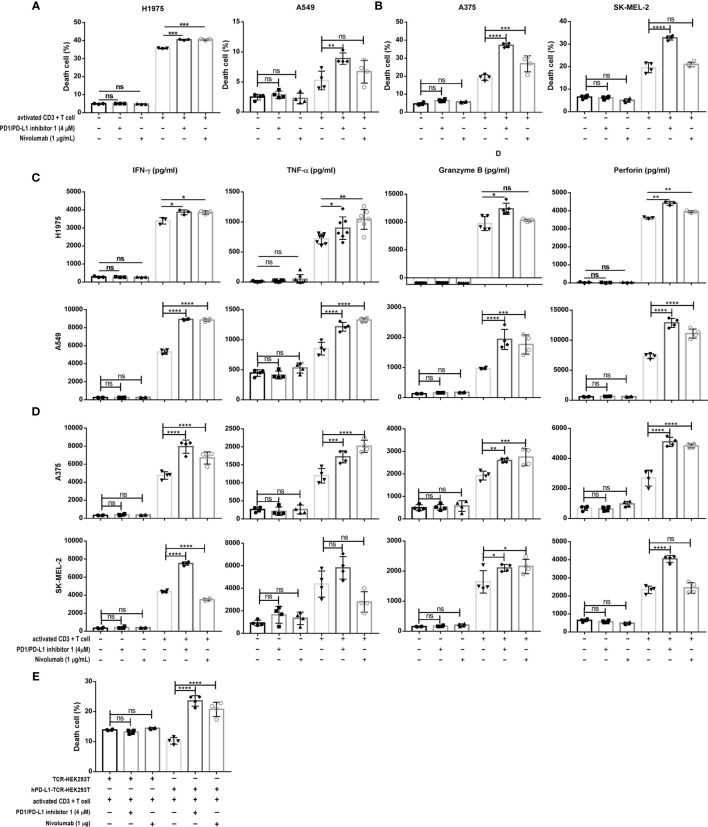
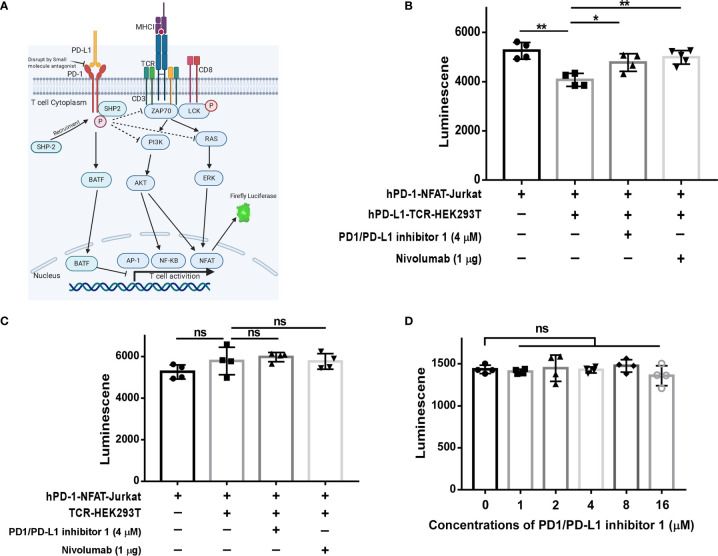
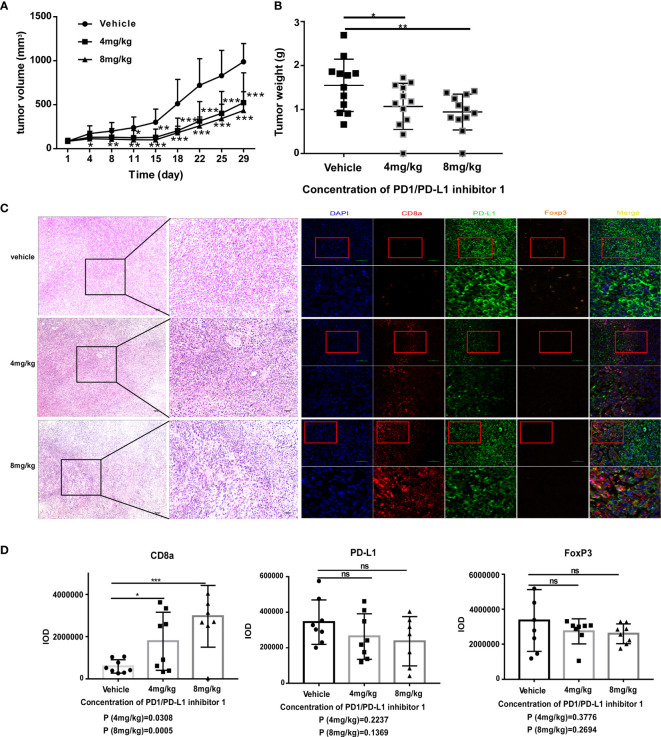
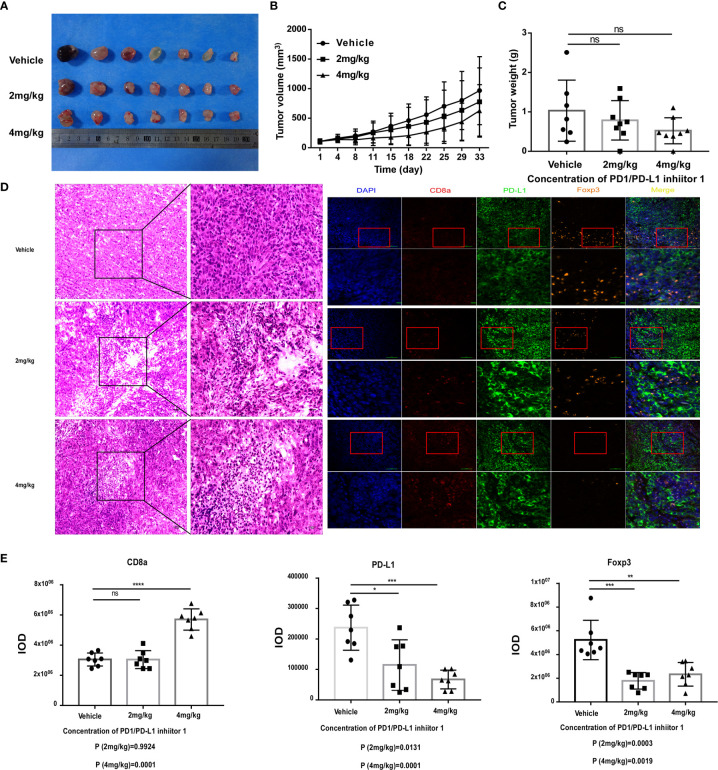
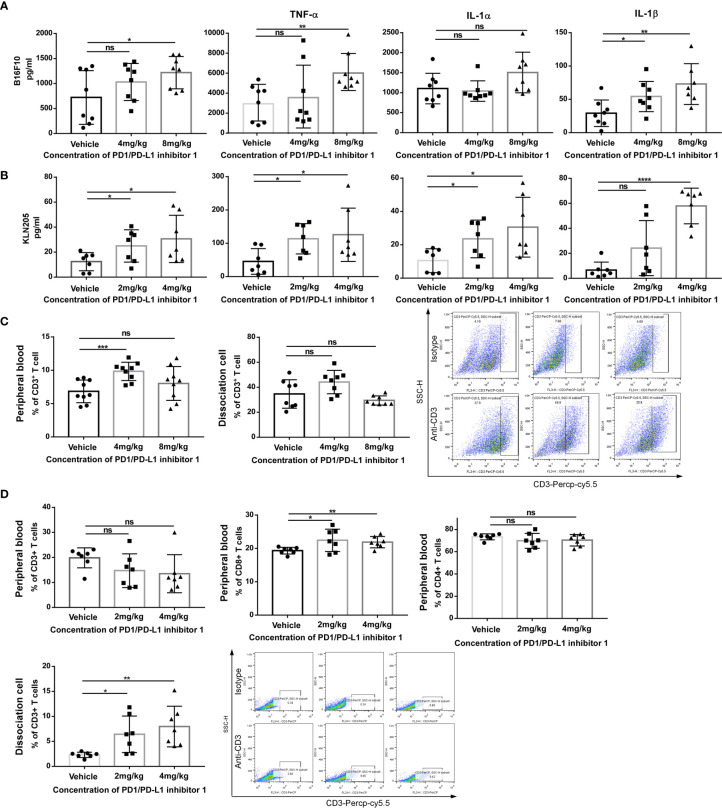
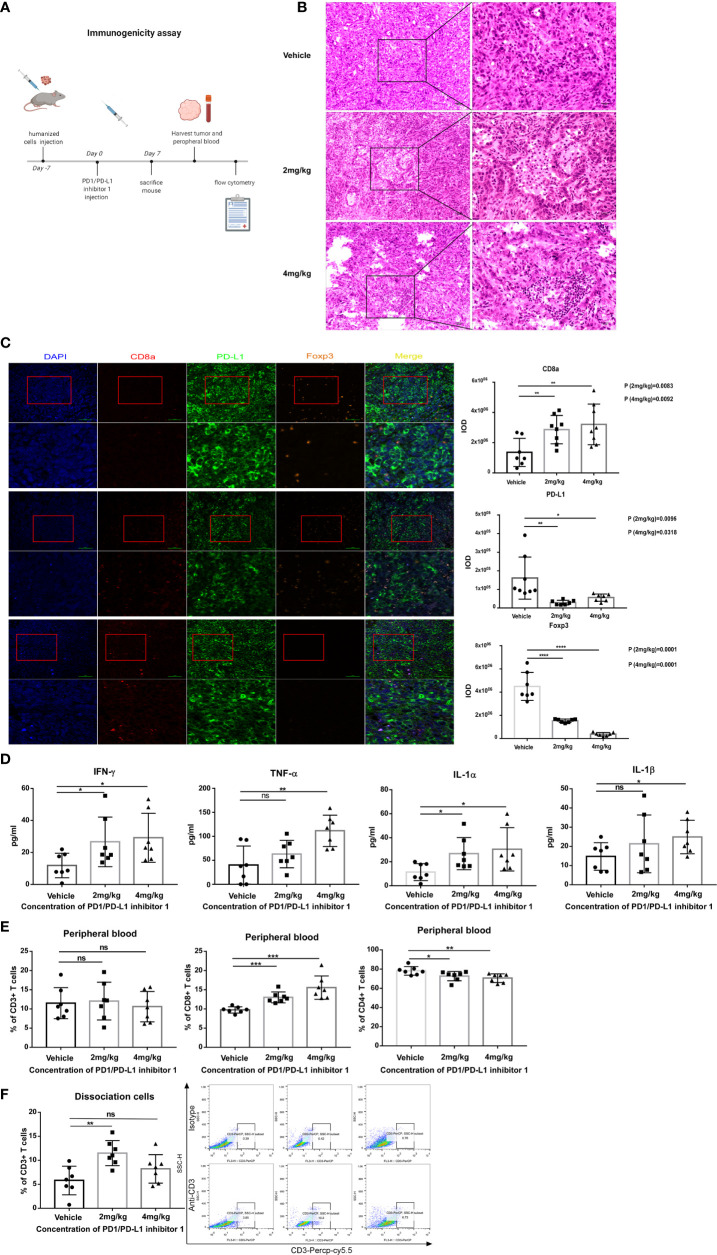
Immune checkpoint inhibitors, such as monoclonal antibodies targeting programmed death 1 (PD-1) and programmed death ligand-1 (PD-L1), have achieved enormous success in the treatment of several cancers. However, monoclonal antibodies are expensive to produce, have poor tumor penetration, and may induce autoimmune side effects, all of which limit their application. Here, we demonstrate that PDI-1 (also name PD1/PD-L1 inhibitor 1), a small molecule antagonist of PD-1/PD-L1 interactions, shows potent anti-tumor activity in vitro and in vivo and acts by relieving PD-1/PD-L1-induced T cell exhaustion. We show that PDI-1 binds with high affinity to purified human and mouse PD-1 and PD-L1 proteins and is a competitive inhibitor of human PD-1/PD-L1 binding in vitro. Incubation of ex vivo activated human T cells with PDI-1 enhanced their cytotoxicity towards human lung cancer and melanoma cells, and concomitantly increased the production of granzyme B, perforin, and inflammatory cytokines. Luciferase reporter assays showed that PDI-1 directly increases TCR-mediated activation of NFAT in a PD-1/PD-L1-dependent manner. In two syngeneic mouse tumor models, the intraperitoneal administration of PDI-1 reduced the growth of tumors derived from human PD-L1-transfected mouse lung cancer and melanoma cells; increased and decreased the abundance of tumor-infiltrating CD8+ and FoxP3+ CD4+ T cells, respectively; decreased the abundance of PD-L1-expressing tumor cells, and increased the production of inflammatory cytokines. The anti-tumor effect of PDI-1 in vivo was comparable to that of the anti-PD-L1 antibody atezolizumab. These results suggest that the small molecule inhibitors of PD-1/PD-L1 may be effective as an alternative or complementary immune checkpoint inhibitor to monoclonal antibodies.
Keywords: PD-1/PD-L1; PD-1/PD-L1 inhibitor 1; PDI-1; T cell activation; immunotherapy; small molecule compound.
Copyright © 2021 Wang, Gu, Tian, Li, Zhao, Yang, Gao, Li, Shim, Zhang, Liu and Lee.
Conflict of interest statement
The authors declare that the research was conducted in the absence of any commercial or financial relationships that could be construed as a potential conflict of interest.
Figures
Similar articles
-
B and T lymphocyte attenuator (BTLA) and PD-1 pathway dual blockade promotes antitumor immune responses by reversing CD8+ T-cell exhaustion in non-small cell lung cancer.Front Immunol. 2025 May 20;16:1553042. doi: 10.3389/fimmu.2025.1553042. eCollection 2025. Front Immunol. 2025. PMID: 40463377 Free PMC article.
-
Discovery of a new inhibitor targeting PD-L1 for cancer immunotherapy.Neoplasia. 2021 Mar;23(3):281-293. doi: 10.1016/j.neo.2021.01.001. Epub 2021 Jan 30. Neoplasia. 2021. PMID: 33529880 Free PMC article.
-
Inhibition of galectin-3 augments the antitumor efficacy of PD-L1 blockade in non-small-cell lung cancer.FEBS Open Bio. 2021 Mar;11(3):911-920. doi: 10.1002/2211-5463.13088. Epub 2021 Jan 31. FEBS Open Bio. 2021. PMID: 33455075 Free PMC article.
-
Study and analysis of antitumor resistance mechanism of PD1/PD-L1 immune checkpoint blocker.Cancer Med. 2020 Nov;9(21):8086-8121. doi: 10.1002/cam4.3410. Epub 2020 Sep 2. Cancer Med. 2020. PMID: 32875727 Free PMC article. Review.
-
Insights into non-peptide small-molecule inhibitors of the PD-1/PD-L1 interaction: Development and perspective.Bioorg Med Chem. 2021 Mar 1;33:116038. doi: 10.1016/j.bmc.2021.116038. Epub 2021 Jan 22. Bioorg Med Chem. 2021. PMID: 33517226 Review.
Cited by
-
A mechanistic quantitative systems pharmacology model platform for translational efficacy evaluation and checkpoint combination design of bispecific immuno-modulatory antibodies.Front Pharmacol. 2025 Apr 10;16:1571844. doi: 10.3389/fphar.2025.1571844. eCollection 2025. Front Pharmacol. 2025. PMID: 40276607 Free PMC article.
-
Design, Synthesis, and Biological Evaluation of 2-Hydroxy-4-phenylthiophene-3-carbonitrile as PD-L1 Antagonist and Its Comparison to Available Small Molecular PD-L1 Inhibitors.J Med Chem. 2023 Jul 27;66(14):9577-9591. doi: 10.1021/acs.jmedchem.3c00254. Epub 2023 Jul 14. J Med Chem. 2023. PMID: 37450644 Free PMC article.
-
Advances in cancer immunotherapy: historical perspectives, current developments, and future directions.Mol Cancer. 2025 May 7;24(1):136. doi: 10.1186/s12943-025-02305-x. Mol Cancer. 2025. PMID: 40336045 Free PMC article. Review.
-
Miniprotein engineering for inhibition of PD-1/PD-L1 interaction.Protein Sci. 2024 Aug;33(8):e5106. doi: 10.1002/pro.5106. Protein Sci. 2024. PMID: 39012010 Free PMC article.
-
[Research Progress on Pathogenic Mechanism and Potential Therapeutic Drugs of Idiopathic Pulmonary Fibrosis Complicated with Non-small Cell Lung Cancer].Zhongguo Fei Ai Za Zhi. 2022 Oct 20;25(10):756-763. doi: 10.3779/j.issn.1009-3419.2022.101.45. Epub 2022 Sep 28. Zhongguo Fei Ai Za Zhi. 2022. PMID: 36167462 Free PMC article. Chinese.
References
Publication types
MeSH terms
Substances
LinkOut - more resources
Full Text Sources
Other Literature Sources
Medical
Research Materials