. 2021 May 14:12:671239.
doi: 10.3389/fimmu.2021.671239. eCollection 2021.

Patients With Common Variable Immunodeficiency (CVID) Show Higher Gut Bacterial Diversity and Levels of Low-Abundance Genes Than the Healthy Housemates

Affiliations

Patients With Common Variable Immunodeficiency (CVID) Show Higher Gut Bacterial Diversity and Levels of Low-Abundance Genes Than the Healthy Housemates

Juraj Bosák et al. Front Immunol. .

Abstract

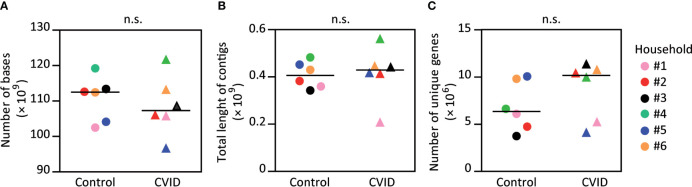
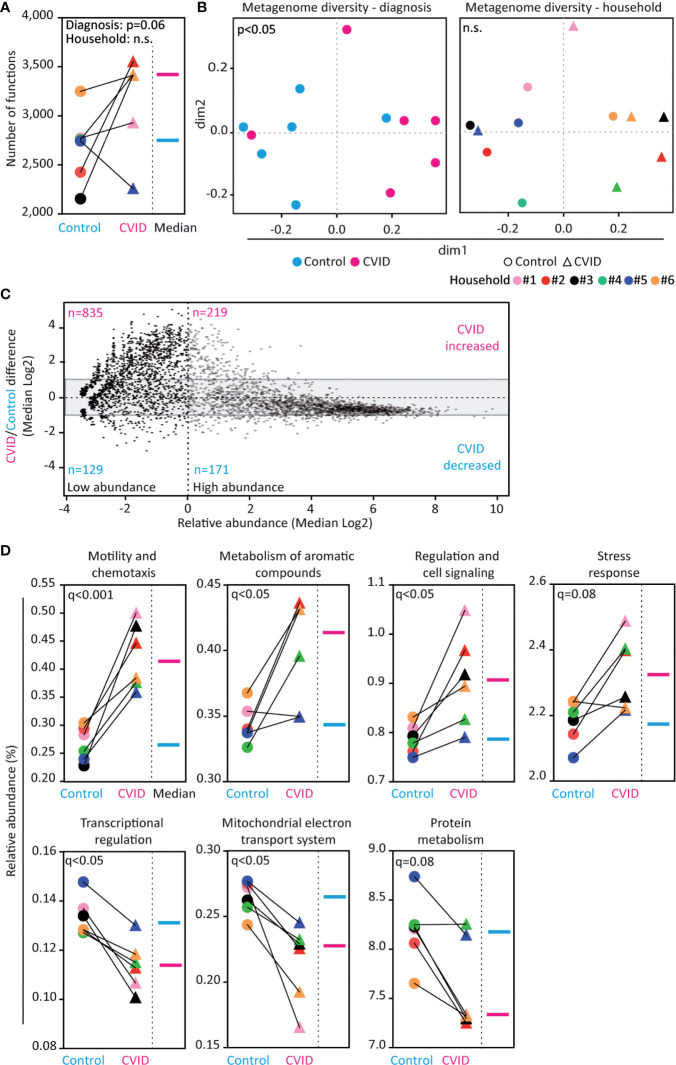
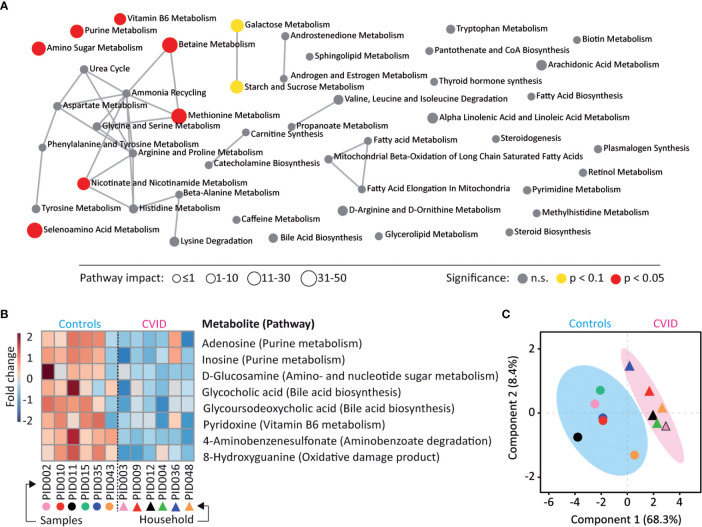
Common variable immunodeficiency (CVID) is a clinically and genetically heterogeneous disorder with inadequate antibody responses and low levels of immunoglobulins including IgA that is involved in the maintenance of the intestinal homeostasis. In this study, we analyzed the taxonomical and functional metagenome of the fecal microbiota and stool metabolome in a cohort of six CVID patients without gastroenterological symptomatology and their healthy housemates. The fecal microbiome of CVID patients contained higher numbers of bacterial species and altered abundance of thirty-four species. Hungatella hathewayi was frequent in CVID microbiome and absent in controls. Moreover, the CVID metagenome was enriched for low-abundance genes likely encoding nonessential functions, such as bacterial motility and metabolism of aromatic compounds. Metabolomics revealed dysregulation in several metabolic pathways, mostly associated with decreased levels of adenosine in CVID patients. Identified features have been consistently associated with CVID diagnosis across the patients with various immunological characteristics, length of treatment, and age. Taken together, this initial study revealed expansion of bacterial diversity in the host immunodeficient conditions and suggested several bacterial species and metabolites, which have potential to be diagnostic and/or prognostic CVID markers in the future.

Keywords: CVID; Hungatella hathewayi; common variable immunodeficiency; metabolome; metagenome; microbiome.


Conflict of interest statement

The authors declare that the research was conducted in the absence of any commercial or financial relationships that could be construed as a potential conflict of interest.

Figures

Figure 1
Figure 1
The fecal microbiomes of CVID patients and healthy controls have similar numbers of determined bases, contig lengths, and numbers of unique genes. The obtained metagenome data showed no difference in number of determined nucleotides (A) and the length of contigs (B) between the CVID patients and healthy controls. The numbers of unique genes were also similar (C). Please, notice an insignificant increase of unique genes for CVID. Mann-Whitney test; n.s., not significant. Symbols, individuals. Black bar, median. Detailed characteristics of samples are shown in Table S2 .
Figure 2
Figure 2
The CVID fecal microbiome shows increased bacterial diversity and differences in bacterial species. (A, B) CVID patients have more bacterial species than healthy housemates, irrespective of the total number of bacterial species identified in the corresponding CVID-control pairs. However, the microbiome composition also associates with household in addition to diagnosis. (C) Bacterial species with significantly increased (magenta) and decreased (cyan) relative abundance in CVID patients compared to healthy housemates (q<0.001, p-values adjusted for control of false discovery rate). Unpaired Mann-Whitney (for Diagnosis) and paired Wilcoxon tests (for Household) (A), Chao dissimilarity matrix, NMDS plot, and nonparametric test ANOSIM (B), and DESeq2 method (C) were used to calculate statistical differences. The complete analysis of taxonomic diversity, including a list of relative abundancies, is shown in Figure S1 , Table S3 , and Table S4 .
Figure 3
Figure 3
Fecal microbiome of CVID patients shows differences in genetic functions. (A, B) CVID patients have more database-identified genetic functions than healthy housemates (p=0.06). The functional metagenome associates with the diagnosis of CVID and not with household. (C) Composition of genes in the CVID metagenome differ from the metagenome of healthy controls. The CVID metagenome was enriched for low-abundance genes (see upper left corner). The grey area (-1 to +1) contains genes with similar abundance between groups (i.e., fold change lower than two). Based on the value of relative abundance 1 (dashed vertical line), the genes were classified as low-abundance (left dimension) and high-abundance (right dimension). (D) Relative abundance of functional groups within the metagenomes. Five functions showed significantly different abundance between the groups (q<0.05) and two other functions showed a corresponding trend (0.05<q<0.1). Unpaired Mann-Whitney (for Diagnosis) and paired Wilcoxon tests (for Household) (A), Chao dissimilarity matrix, NMDS plot, and nonparametric test ANOSIM (B), ALDeX2 method (Analysis of differential abundance taking sample variation into account) (C), and DESeq2 method (D) were used to calculate the statistical differences. Database SEED level 3 (A–C) and level 1 (D) was used for functional analysis. The complete analysis of functional diversity, including a list of relative abundancies, is shown in Figure S1 , Table S3 , and Table S5 .
Figure 4
Figure 4
CVID stool metabolome shows differences in purine metabolism. (A) Metabolites identified in the LC-MS metabolome analysis belonged to 46 metabolic pathways and seven pathways showed dysregulation between CVID and healthy controls (p<0.05, QEA). Symbol size represents the pathway impact, which considers the relative abundance of metabolites in pathways (30, 31). (B) A heat map of eight metabolites significantly different between CVID and controls (p<0.05, Mann-Whitney). (C) The association of significant metabolites with diagnosis (R2=0.86, PLS-DA). (A–C) The MetaboAnalyst was used for visualizations and statistical calculations. Complete metabolomic analysis is shown in Table S6 .

Similar articles

Cited by

References

    1. Guarner F, Malagelada JR. Gut Flora in Health and Disease. Lancet (2003) 361:512–9. 10.1016/S0140-6736(03)12489-0 - DOI - PubMed
    1. Quigley EMM. Gut Bacteria in Health and Disease. Gastroenterol Hepatol (NY) (2013) 9:560–9. - PMC - PubMed
    1. Pascale A, Marchesi N, Marelli C, Coppola A, Luzi L, Govoni S, et al. Microbiota and Metabolic Diseases. Endocrine (2018) 61:357–71. 10.1007/s12020-018-1605-5 - DOI - PubMed
    1. Zheng D, Liwinski T, Elinav E. Interaction Between Microbiota and Immunity in Health and Disease. Cell Res (2020) 30:492–506. 10.1038/s41422-020-0332-7 - DOI - PMC - PubMed
    1. Bogaert DJA, Dullaers M, Lambrecht BN, Vermaelen KY, De Baere E, Haerynck F. Genes Associated With Common Variable Immunodeficiency: One Diagnosis to Rule Them All? J Med Genet (2016) 53:575–90. 10.1136/jmedgenet-2015-103690 - DOI - PubMed

Publication types

Supplementary concepts

LinkOut - more resources