. 2021 May 12:12:680855.
doi: 10.3389/fimmu.2021.680855. eCollection 2021.

Acute Hemolysis and Heme Suppress Anti-CD40 Antibody-Induced Necro-Inflammatory Liver Disease

Affiliations

Acute Hemolysis and Heme Suppress Anti-CD40 Antibody-Induced Necro-Inflammatory Liver Disease

Marc Pfefferlé et al. Front Immunol. .

Abstract

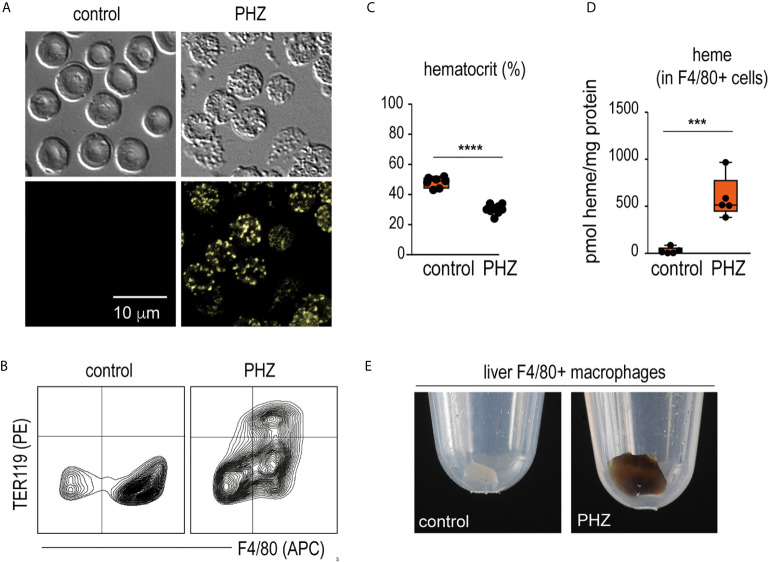
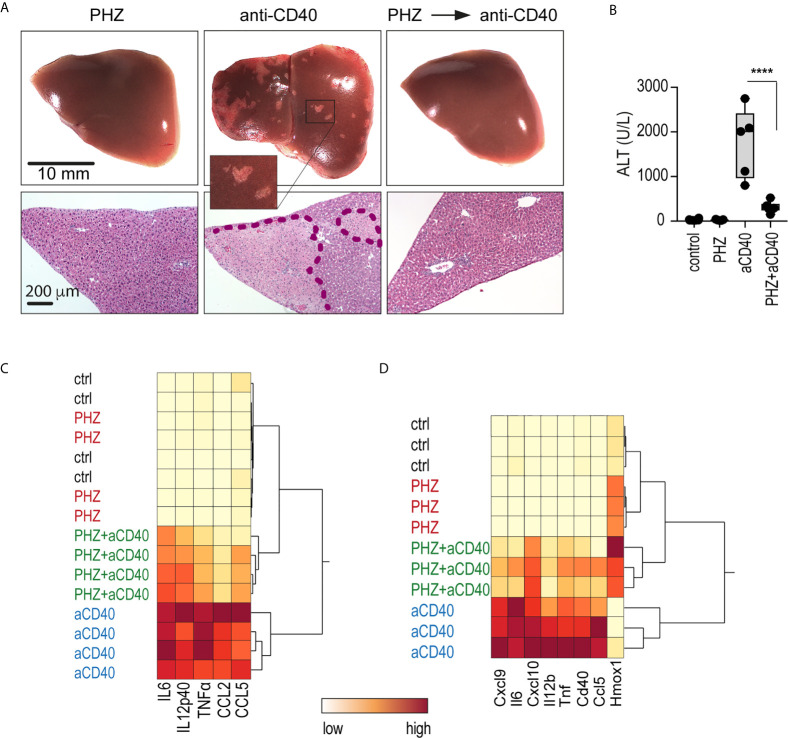
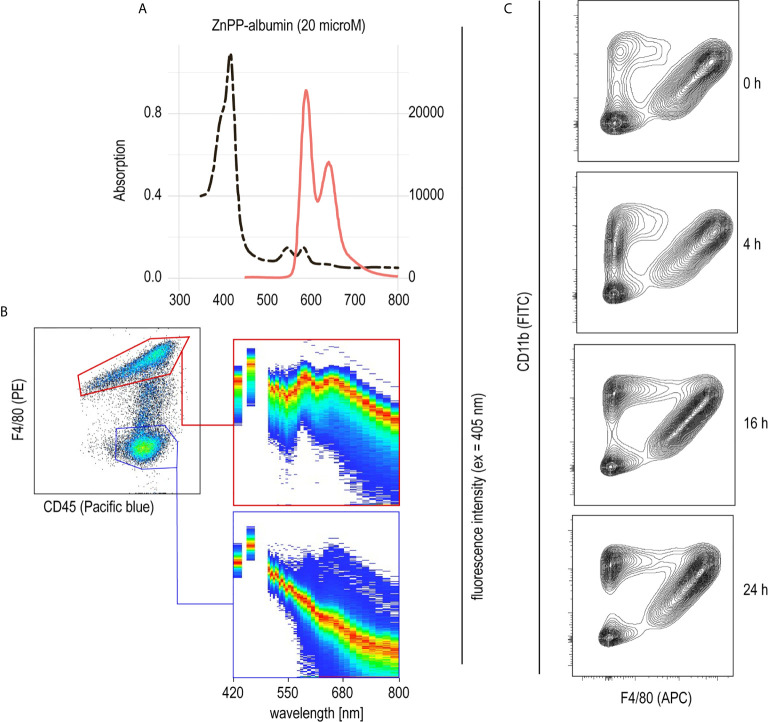
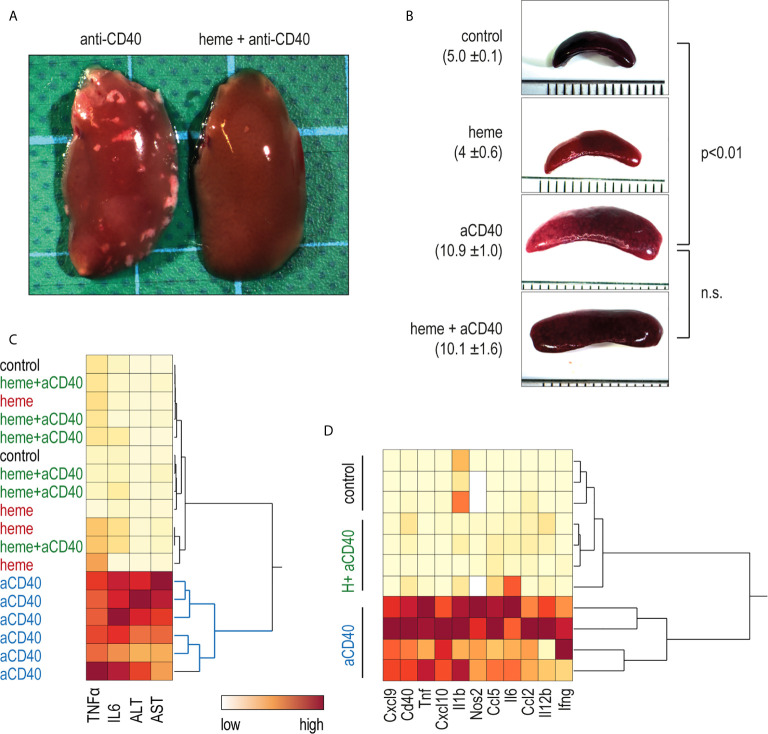
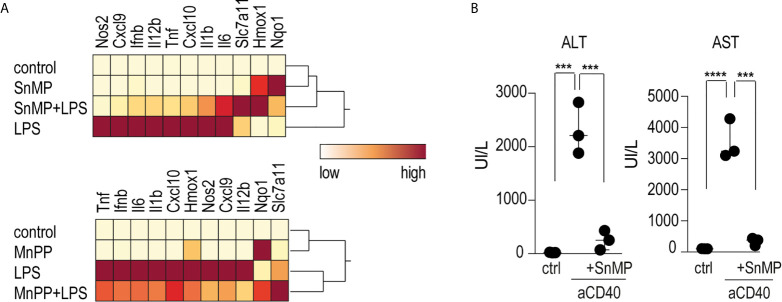
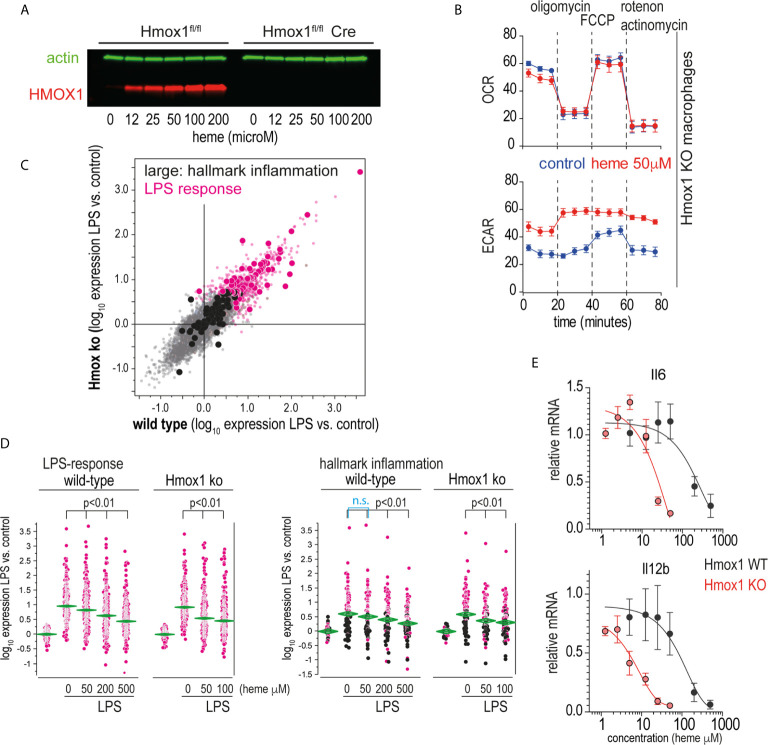
Clearance of red blood cells and hemoproteins is a key metabolic function of macrophages during hemolytic disorders and following tissue injury. Through this archetypical phagocytic function, heme is detoxified and iron is recycled to support erythropoiesis. Reciprocal interaction of heme metabolism and inflammatory macrophage functions may modify disease outcomes in a broad range of clinical conditions. We hypothesized that acute hemolysis and heme induce acute anti-inflammatory signals in liver macrophages. Using a macrophage-driven model of sterile liver inflammation, we showed that phenylhydrazine (PHZ)-mediated acute erythrophagocytosis blocked the anti-CD40 antibody-induced pathway of macrophage activation. This process attenuated the inflammatory cytokine release syndrome and necrotizing hepatitis induced by anti-CD40 antibody treatment of mice. We further established that administration of heme-albumin complexes specifically delivered heme to liver macrophages and replicated the anti-inflammatory effect of hemolysis. The anti-inflammatory heme-signal was induced in macrophages by an increased intracellular concentration of the porphyrin independently of iron. Overall, our work suggests that induction of heme-signaling strongly suppresses inflammatory macrophage function, providing protection against sterile liver inflammation.

Keywords: anti-CD40; erythrophagocytosis; heme; hepatitis; inflammation.


Conflict of interest statement

The authors declare that the research was conducted in the absence of any commercial or financial relationships that could be construed as a potential conflict of interest.

Figures

Figure 1
Figure 1
PHZ administration induces acute erythrophagocytosis in F4/80+ liver macrophages C57Bl/6J mice were treated with saline (control) or phenylhydrazine (PHZ, 90 mg/kg) and sacrificed 24 or 48 h later for blood and organ collection. (A) RBCs of saline- and PHZ-treated C57Bl/6J mice. Upper panels: DIC brightfield image at 600x magnification, lower panels: autofluorescence of Heinz bodies in the green fluorescence channel. (B) Representative flow cytometry density plots of liver cells stained for F4/80 and intracellular TER-119 and gated from CD45+ liver cells. Data were obtained from a control mouse and a mouse after PHZ treatment. (C) Hematocrit of saline- and PHZ-treated mice at 48 h (n = 7–10). (D) Heme concentrations in purified F4/80+ liver macrophages isolated by positive selection using anti-F4/80 antibody coated magnetic beads, followed by magnetic-activated cell sorting (MACS) from control and PHZ-treated mice (n=5). Heme concentration was normalized to total protein levels in each group. No significant difference in total protein levels was observed between groups. (E) Representative photographs of cell pellets of purified F4/80+ liver macrophages from saline- and PHZ-treated mice. Individual symbols represent one mouse; ****p < 0.0001 and ***p < 0.001.
Figure 2
Figure 2
PHZ administration prevents anti-CD40 antibody induced inflammatory liver disease. C57Bl/6J mice were treated with saline (control) or PHZ (90 mg/kg) at T0h, 48 h later with anti-CD40 antibody (20 mg/kg) (T48h). The animals were sacrificed at T60h for plasma cytokines, at T78h for liver enzymes, and at T96h for liver histology. (A) Representative photographs of liver lobes and H&E-stained liver tissue sections. Ischemic infarcts were detected in the anti-CD40 antibody-treated mice (visible as white spots on the liver lobes in the area within the violet dashed line on histology). (B) Plasma concentrations of ALT in C57BL/6J mice after treatment with PHZ and/or anti-CD40 antibody (n = 5). (C) Heatmap displaying color-coded plasma concentrations of IL6, IL12p40, TNFα, CCL2, and CCL5 in C57BL/6J mice after treatment with PHZ or anti-CD40 antibody (n = 4) (yellow=low expression, red=high expression). (D) Heatmap displaying color-coded mRNA expression levels of pro-inflammatory cytokines and Hmox1 from Dynabeads-enriched F4/80 positive liver macrophages in C57BL/6J mice after treatment with PHZ or an anti-CD40 antibody (n = 3) (yellow=low expression, red=high expression). mRNA expression was measured by qRT-PCR. Individual symbols represent one mouse; ****p < 0.0001.
Figure 3
Figure 3
Selective uptake of ZnPP-albumin by F4/80+ liver macrophages (A) Excitation (dotted black line) and emission (full red line) spectra of ZnPP-albumin excited at 405 nm measured in solution. (B) Spectral plots recorded with a spectral cell analyzer for the CD45+/F4/80+ (red) and CD45+/F4/80- (blue) leukocyte populations in a suspension of liver cells from a C57BL/6J mouse treated with ZnPP-albumin. Livers were collected 2 h after the injection. The plots show the cell density on an intensity-wavelength matrix. The red line (area of highest density) indicates the excitation spectrum of the selected cell population. (C) Representative flow cytometry density plots of liver single cell suspensions stained for CD11b and F4/80 and gated for live CD45+ cells. Livers were collected before (0 h) and 4, 16, or 24 h after heme-albumin injection.
Figure 4
Figure 4
Heme-albumin administration prevents anti-CD40 antibody driven inflammatory liver disease. C57Bl/6J mice were injected with heme-albumin (70 µmol/kg, i.p.) and after 4 h with anti-CD40 antibody (20 mg/kg). The animals were sacrificed at T16h for plasma cytokines or mRNA gene expression, at T34h for liver enzymes, and at T52h for liver histology. (A) Representative macroscopic photographs of the liver lobe from mice injected with anti-CD40 antibody, with or without heme-albumin. Necrosis is visible as a white spot. (B) Representative macroscopic images of the spleen of mice treated with anti-CD40 antibody, with or without heme-albumin. Displayed is the average size of the spleens (mm) ± 2 SDs. (C) Heatmap displaying the color-coded plasma concentrations of IL6, TNFα, and liver enzymes (ALT and AST) in animals treated with heme-albumin (heme) or albumin (control) and challenged with or without anti-CD40 antibody (yellow=low concentration, red=high concentration). (D) Heatmap displaying the color-coded mRNA expression levels of proinflammatory cytokines in Dynabeads-enriched F4/80+ liver macrophages in C57BL/6J mice that were treated with heme-albumin (heme) or albumin (control) and stimulated with or without anti-CD40 antibody. These data demonstrate that acute heme-albumin treatment mitigated macrophage-driven inflammation and suppressed anti-CD40 antibody mediated disease.
Figure 5
Figure 5
Heme suppresses inflammation independently of iron levels (A) Heatmap displaying color-coded mRNA relative expression of proinflammatory and anti-oxidative genes in BMDMs treated with the noniron porphyrin SnMP (top) or MnPP (bottom) for 4 h before stimulation with LPS (10 ng/mL) for an additional 4 h. The data represent the mean expression values from three independent experiments (yellow=low expression, red=high expression). (B) Plasma ALT and AST concentrations in C57BL/6J mice treated with or without SnMP-albumin (70 μmol/kg, i.p.) and after 4 h with anti-CD40 antibody for 30 h (20 mg/kg) (n = 3). From these data, we could conclude that metalloporphyrins linked to albumin could replicate the inflammatory suppression of heme-albumin in vitro and in vivo. ****p < 0.0001, ***p < 0.001 for all panels.
Figure 6
Figure 6
Heme suppresses inflammation independently of its metabolites. (A) Western blot of HMOX1 in BMDMs from Hmox1fl/f UBC Cre-ERT2 (knockout) and Hmox1fl/fl (wild-type) mice after exposure to heme-albumin concentrations ranging from 0 to 200 µM for 4 h and LPS treatment for an additional 4 h. Beta-actin was used as a loading control. No HMOX1 expression is visible in the knockout macrophages. (B) Oxygen consumption rate (OCR) and extracellular acidification rate (ECAR) of heme-albumin (50 μM)- and albumin (control)-exposed Hmox1 knockout and wild-type BMDMs were measured using a Seahorse XFe24 extracellular flux analyzer. Measurements (n = 3) were recorded according to the standard protocol at baseline, after addition of oligomycin (an inhibitor of ATP synthase), after addition of carbonyl cyanide-4 (trifluoromethoxy) phenylhydrazone (FCCP) (an uncoupling agent, which allows to measure maximum mitochondrial oxygen consumption), and after addition of combined actinomycin A and rotenone (which shuts down mitochondrial respiration). (C) Correlation plot of mean mRNA expression changes in wild-type (Hmox1fl/fl) and Hmox1-knockout (Hmox1fl/fl UBC Cre-ERT2) BMDMs that were treated with LPS for 4 h (n = 4 experiments). All genes that were significantly upregulated by LPS are shown in pink (= LPS response). All the genes that define the hallmark “inflammation” gene set in the Molecular Signature Database are depicted with enlarged dots (black and pink). (D) Selective presentation of relative expression data for the transcripts defining the “LPS response” and “inflammation” classes across macrophages treated with LPS with/without heme. Statistical analyses of the average expression data were performed by ANOVA with Tukey’s post hoc test for multiple comparisons. The data demonstrate a dose-dependent attenuation of the expression of LPS-induced genes with increasing heme-albumin concentrations, and this effect was more pronounced in the absence of Hmox1 expression. (E) Relative expression of LPS-induced Il6 and Il12b mRNA in BMDMs from Hmox1fl/fl UBC Cre-ERT2 mice (knockout, red) and Hmox1fl/fl mice (wild-type, black) in response to increasing heme-albumin concentrations. The cells were treated with heme-albumin for 4 h before LPS stimulation. An expression level of 1.0 indicates the mean cytokine mRNA expression in LPS-treated cells in the absence of heme-albumin. The data show the mean ± SD of six biological replicates measured in parallel. n.s., not significant.

Similar articles

Cited by

References

    1. Schaer DJ, Alayash AI. Clearance and Control Mechanisms of Hemoglobin From Cradle to Grave. Antioxid Redox Signal (2010) 12:181–4. 10.1089/ars.2009.2923 - DOI - PubMed
    1. Theurl I, Hilgendorf I, Nairz M, Tymoszuk P, Haschka D, Asshoff M, et al. . On-Demand Erythrocyte Disposal and Iron Recycling Requires Transient Macrophages in the Liver. Nat Med (2016) 22:945–51. 10.1038/nm.4146 - DOI - PMC - PubMed
    1. Soares MP, Hamza I. Macrophages and Iron Metabolism. Immunity (2016) 44:492–504. 10.1016/j.immuni.2016.02.016 - DOI - PMC - PubMed
    1. Knutson M, Wessling-Resnick M. Iron Metabolism in the Reticuloendothelial System. Crit Rev Biochem Mol Biol (2003) 38:61–88. 10.1080/713609210 - DOI - PubMed
    1. Korolnek T, Hamza I. Macrophages and Iron Trafficking At the Birth and Death of Red Cells. Blood (2015) 125:2893–7. 10.1182/blood-2014-12-567776 - DOI - PMC - PubMed

Publication types

MeSH terms