. 2021 May 13:12:682415.
doi: 10.3389/fimmu.2021.682415. eCollection 2021.

Integrative Analysis of Neuregulin Family Members-Related Tumor Microenvironment for Predicting the Prognosis in Gliomas

Affiliations

Integrative Analysis of Neuregulin Family Members-Related Tumor Microenvironment for Predicting the Prognosis in Gliomas

Wei-Jiang Zhao et al. Front Immunol. .

Abstract

Gliomas, including brain lower grade glioma (LGG) and glioblastoma multiforme (GBM), are the most common primary brain tumors in the central nervous system. Neuregulin (NRG) family proteins belong to the epidermal growth factor (EGF) family of extracellular ligands and they play an essential role in both the central and peripheral nervous systems. However, roles of NRGs in gliomas, especially their effects on prognosis, still remain to be elucidated. In this study, we obtained raw counts of RNA-sequencing data and corresponding clinical information from 510 LGG and 153 GBM samples from The Cancer Genome Atlas (TCGA) database. We analyzed the association of NRG1-4 expression levels with tumor immune microenvironment in LGG and GBM. GSVA (Gene Set Variation Analysis) was performed to determine the prognostic difference of NRGs gene set between LGG and GBM. ROC (receiver operating characteristic) curve and the nomogram model were constructed to estimate the prognostic value of NRGs in LGG and GBM. The results demonstrated that NRG1-4 were differentially expressed in LGG and GBM in comparison to normal tissue. Immune score analysis revealed that NRG1-4 were significantly related to the tumor immune microenvironment and remarkably correlated with immune cell infiltration. The investigation of roles of m6A (N6-methyladenosine, m6A)-related genes in gliomas revealed that NRGs were prominently involved in m6A RNA modification. GSVA score showed that NRG family members are more associated with prognosis in LGG compared with GBM. Prognostic analysis showed that NRG3 and NRG1 can serve as potential independent biomarkers in LGG and GBM, respectively. Moreover, GDSC drug sensitivity analysis revealed that NRG1 was more correlated with drug response compared with other NRG subtypes. Based on these public databases, we preliminarily identified the relationship between NRG family members and tumor immune microenvironment, and the prognostic value of NRGs in gliomas. In conclusion, our study provides comprehensive roles of NRG family members in gliomas, supporting modulation of NRG signaling in the management of glioma.

Keywords: GSVA; gliomas; m6A modification; neuregulin family; prognosis; tumor microenvironment.


Conflict of interest statement

The authors declare that the research was conducted in the absence of any commercial or financial relationships that could be construed as a potential conflict of interest.

Figures
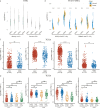
Figure 1
Figure 1
mRNA expression level of NRG family members. NRGs expression levels in the brain (n=1152) and nerve (n=278) from GTEx database (A). NRGs expression levels in LGG (n=510), GBM (n=153) and normal tissues from GTEx (n=2642) and TCGA (n=5) database (B). NRGs expression levels in LGG (n=510) and GBM (n=153) from TCGA database (C). NRGs expression levels in patients of different genders with LGG (Female: n=228; Male: n=282) and GBM (Female: n=54; Male: n=99) (D). The significance of the two groups of samples passed the Wilcox test. ns, no significance; *P < 0.05; **P < 0.01; ***P < 0.001; ****P < 0.0001.
Figure 2
Figure 2
Landscape of the TME in LGG and GBM. The score heatmap of 22 immune cells in LGG and GBM, where different colors represent the expression trend in different samples (A) (LGG: n=510, GBM: n=153, Normal: n=5). The percentage abundance of tumor-infiltrating immune cells in each sample, with different colors representing different types of immune cells (B). The abscissa represents the samples, and the ordinate represents the percentage of immune cell content in a single sample. The expression heatmap (C) and distribution (D) of immune checkpoints-related genes in LGG and GBM, where different colors represent the expression trend in different samples (LGG: n=510, GBM: n=153, Normal: n=2647). Correlation between NRG1-4 expression and immune infiltrates in both LGG (E) and GBM (F). The significance of the different groups of samples passed the Kruskal-Wallis test. *P < 0.05; ***P < 0.001.
Figure 3
Figure 3
Correlations between NRGs expression and immune cell infiltration in LGG. Correlations between the abundance of 6 immune cells (B cell, CD4 T cell, CD8 T cell, neutrophils, macrophage and dendritic cell) from TIMER database and the expression of NRG1-4 in LGG. Spearman’s correlation analysis was used to describe the correlation. P < 0.05 was considered statistically significant.
Figure 4
Figure 4
Correlations between NRGs expression and immune cell infiltration in GBM. Correlations between the abundance of 6 immune cells (B cell, CD4+ T cell, CD8+ T cell, neutrophils, macrophage and dendritic cell) from the TIMER database and the expression of NRG1-4 in GBM. Spearman’s correlation analysis was used to describe the correlation. P < 0.05 was considered statistically significant.
Figure 5
Figure 5
Immune scores of NRGs in patients with LGG and GBM. Correlations between the immune score (ImmuneScore, ESTIMATEScore, and StromalScore) and the expression of NRG1-4 in LGG and GBM. Spearman’s correlation analysis was used to describe the correlation. P < 0.05 was considered statistically significant.
Figure 6
Figure 6
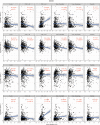
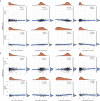
Correlations between NRGs expression and TMB/MSI in LGG and GBM. Correlation analysis of NRG1-4 expression and TMB (A) /MSI (B) in LGG and GBM. The horizontal axis represents the expression distribution of NRG1-4, and the ordinate represents the expression distribution of TMB/MSI score. The density curve on the right represents the distribution trend of TMB/MSI score; the upper density curve represents the distribution trend of NRG1-4. Spearman’s correlation analysis was used to describe the correlation. P < 0.05 was considered statistically significant.
Figure 7
Figure 7
Correlations between NRGs expression and neoantigens/immune checkpoint in LGG and GBM. Correlation analysis of NRG1-4 expression and neoantigen counts in LGG and GBM (A). The horizontal axis represents the expression distribution of NRG1-4, and the ordinate is the distribution of neoantigen counts. The density curve on the right represents the distribution trend of neoantigen counts; the upper density curve represents the distribution trend of NRG1-4. Correlations between immune checkpoint-related genes and the expression of NRG1-4 in LGG and GBM (B). Spearman’s correlation analysis was used to describe the correlation. *P < 0.05; **P <0.01; ***P < 0.001.
Figure 8
Figure 8
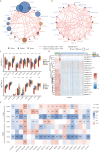
The expression distribution of the m6A-related genes in LGG and GBM. Correlation network analysis of the m6A-related genes in LGG (A) and GBM (B). The circle represents the m6A-related genes, and the line represents the relationship between genes. The red represents the positive correlation and the blue represents the negative correlation, with lines of different thickness representing the extent of correlation between two genes. Larger circles represent higher prognosis log-rank p, with the brown, blue and orange circles representing writers, readers, and erasers, respectively. Expression level of m6A-related genes in LGG and GBM (C), and expression distribution heatmap of m6A-related genes in LGG and GBM, where different colors represent the expression trend in different samples (LGG: n=510, GBM: n=153, Normal tissue: n=2647) (D). Correlations between m6A-related genes and the expression of NRG1-4 in LGG and GBM (E). The significance of the different groups of samples passed the Kruskal-Wallis test, and Spearman’s correlation analysis was used to describe the correlation. *P < 0.05; **P < 0.01; ***P < 0.001.
Figure 9
Figure 9
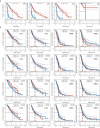
Kaplan-Meier survival analysis of NRGs in LGG and GBM. Kaplan-Meier survival analysis of LGG and GBM, including overall survival (OS), progression-free survival (PFS), disease-specific survival (DSS) and disease-free survival (DFS) (A). Kaplan-Meier survival analysis of NRG1-4 in LGG and GBM, including OS and PFS (B).
Figure 10
Figure 10
Gene Set Variation Analysis of NRGs in LGG and GBM. Survival between high and low GSVA score in both LGG and GBM (A). OS probability analysis for high and low GSVA scores of NRG1-4 in LGG (B) and GBM (C). PFS probability analysis for high and low GSVA scores of NRG1-4 in LGG (D) and GBM (E).
Figure 11
Figure 11
Prognostic value of NRGs in LGG and GBM. Univariate and multivariate Cox regression of NRG1-4 in LGG (A) and GBM (B). Nomogram to predict the 1, 2 and 3-year overall survival of patients with LGG (C) and GBM (D). The dashed diagonal line represents the ideal nomogram, and the blue, red and orange lines represent the 1, 2 and 3-year observed nomograms, respectively. Risk model and prognostic analysis of NRG3 in LGG (E), and NRG1 in GBM (F), respectively. The prognostic risk model shows the Risk type (top left), patient status (middle left) and mRNA expression heatmap (bottom left), and Kaplan–Meier curves of OS (top right) and time-dependent ROC (bottom right) for NRG3 in LGG (E) and NRG1 in GBM (F).
Figure 12
Figure 12
Functional enrichment for gene set associated with high/low expression of NRG3 in patients with LGG. Differentially expressed genes for high expression of NRG3 vs low expression of NRG3 in LGG were shown in the volcano plot (A), with blue dots representing significantly down-regulated genes and orange dots representing significantly up-regulated genes in high expression of NRG3 in LGG, and heatmap exhibits the expression level. Enrichment analysis for KEGG pathway and GO term of down-regulated genes and up-regulated genes in high expression of NRG3 in LGG (B).
Figure 13
Figure 13
Functional enrichment for gene set associated with high/low expression of NRG1 in patients with GBM. Differentially expressed genes for high expression of NRG1 vs low expression of NRG1 in GBM were shown in the volcano plot (A), with blue dots representing significantly down-regulated genes and orange dots representing significantly up-regulated genes in GBM with high expression of NRG1. The heatmap exhibits the expression level. Enrichment analysis for KEGG pathway and GO term of down-regulated genes and up-regulated genes in GBM with high expression of NRG1 (B).
Figure 14
Figure 14
GDSC drug sensitivity analysis. Correlation between NRG1-4 expression and GDSC drug sensitivity in pan-cancer.

Similar articles

Cited by

References

    1. Ostrom QT, Cioffi G, Gittleman H, Patil N, Waite K, Kruchko C, et al. . Cbtrus Statistical Report: Primary Brain and Other Central Nervous System Tumors Diagnosed in the United States in 2012-2016. Neuro Oncol (2019) 21:v1–v100. 10.1093/neuonc/noz150 - DOI - PMC - PubMed
    1. Wen PY, Huse JT. 2016 World Health Organization Classification of Central Nervous System Tumors. Continuum (Minneap Minn) (2017) 23:1531–47. 10.1212/CON.0000000000000536 - DOI - PubMed
    1. Li G, Jiang Y, Lyu X, Cai Y, Zhang M, Li G, et al. . Gene Signatures Based on Therapy Responsiveness Provide Guidance for Combined Radiotherapy and Chemotherapy for Lower Grade Glioma. J Cell Mol Med (2020) 24:4726–35. 10.1111/jcmm.15145 - DOI - PMC - PubMed
    1. Kiran M, Chatrath A, Tang X, Keenan DM, Dutta A. A Prognostic Signature for Lower Grade Gliomas Based on Expression of Long non-Coding Rnas. Mol Neurobiol (2019) 56:4786–98. 10.1007/s12035-018-1416-y - DOI - PMC - PubMed
    1. Hofer S, Roelcke U, Herrmann R. [New Aspects of Interdisciplinary Therapy for Malignant Gliomas in Adults]. Schweiz Med Wochenschr (1999) 129:1332–41. - PubMed

Publication types

MeSH terms

LinkOut - more resources