. 2021 May 12:12:629361.
doi: 10.3389/fpls.2021.629361. eCollection 2021.

Metabolome and Transcriptome Integration Reveals Insights Into Flavor Formation of 'Crimson' Watermelon Flesh During Fruit Development

Affiliations

Metabolome and Transcriptome Integration Reveals Insights Into Flavor Formation of 'Crimson' Watermelon Flesh During Fruit Development

Chengsheng Gong et al. Front Plant Sci. .

Abstract

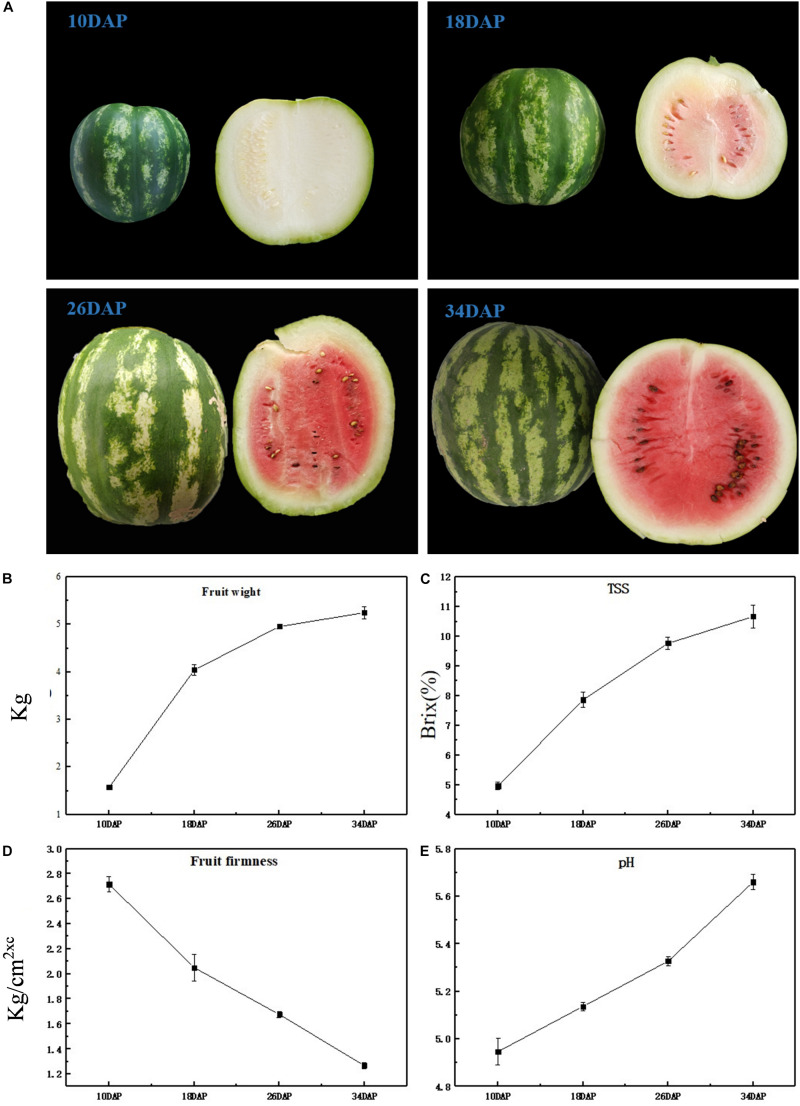
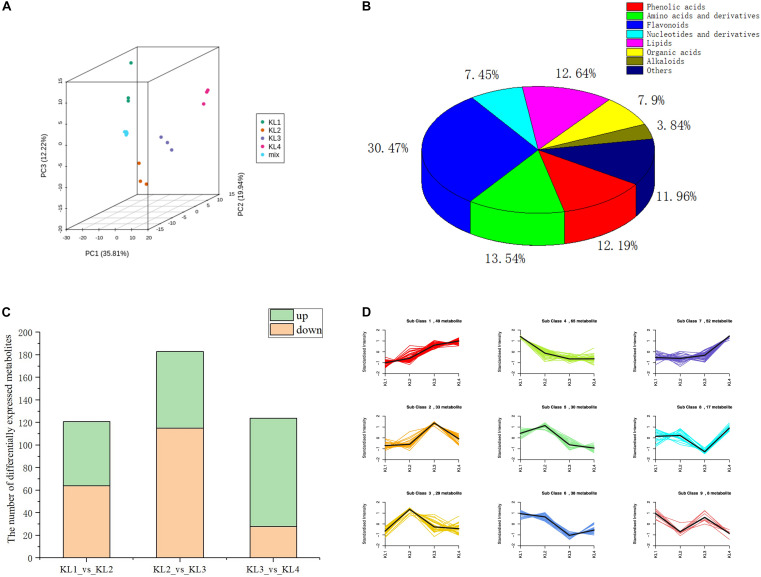
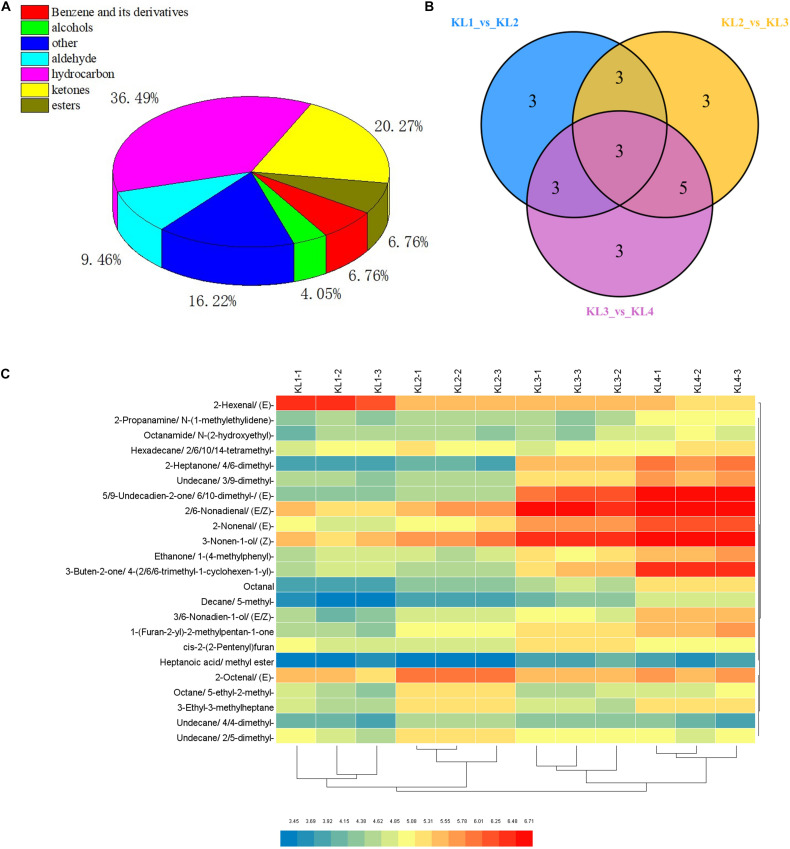
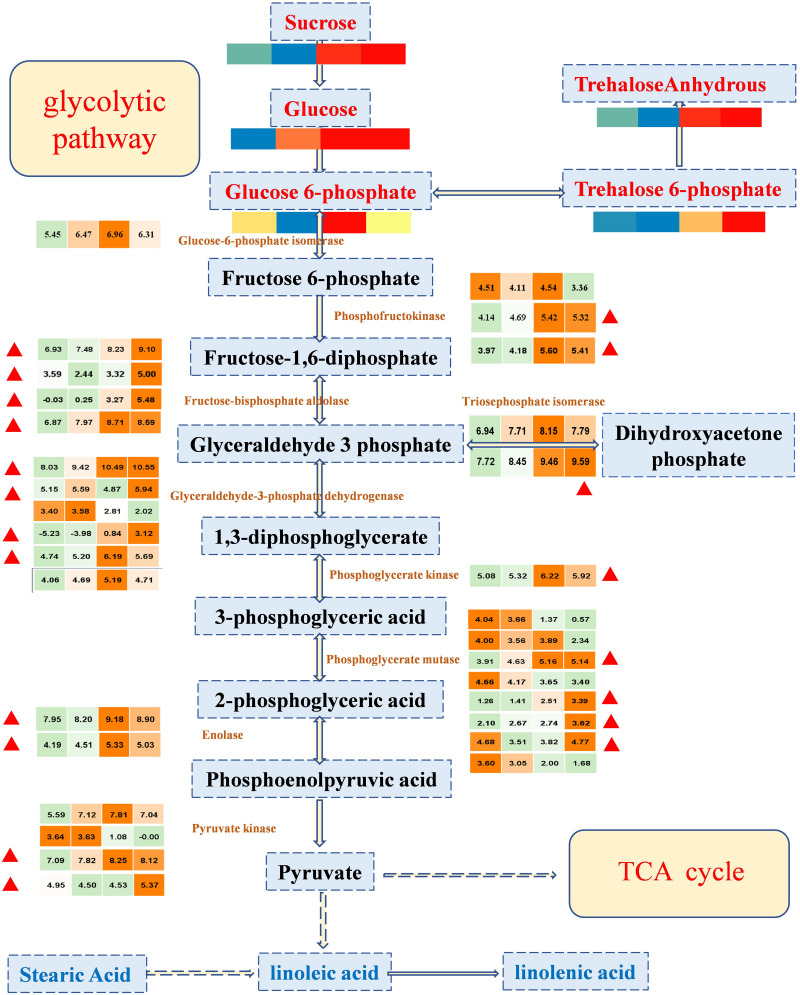
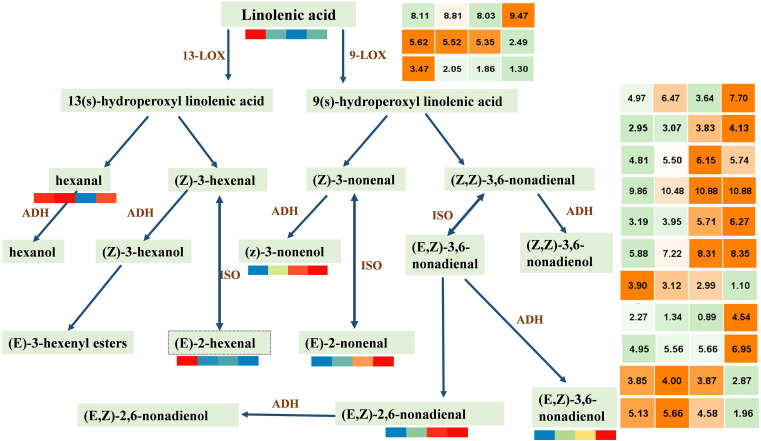
Metabolites have been reported as the main factor that influences the fruit flavor of watermelon. But the comprehensive study on the dynamics of metabolites during the development of watermelon fruit is not up-to-date. In this study, metabolome and transcriptome datasets of 'Crimson' watermelon fruit at four key developmental stages were generated. A total of 517 metabolites were detected by ultrahigh-performance liquid chromatography-electrospray ionization-tandem mass spectrometry and gas chromatography-solid-phase microextraction-mass spectrometry. Meanwhile, by K-means clustering analysis, the total differentially expressed genes were clustered in six classes. Integrating transcriptome and metabolome data revealed similar expression trends of sugars and genes involved in the glycolytic pathway, providing molecular insights into the formation of taste during fruit development. Furthermore, through coexpression analysis, we identified five differentially expressed ADH (alcohol dehydrogenase) genes (Cla97C01G013600, Cla97C05G089700, Cla97C01G001290, Cla97C05G095170, and Cla97C06G118330), which were found to be closely related to C9 alcohols/aldehydes, providing information for the formation of fruit aroma. Our findings establish a metabolic profile during watermelon fruit development and provide insights into flavor formation.

Keywords: coexpression; metabolome; sugars; transcriptome; volatile organic compounds; watermelon.


Conflict of interest statement

The authors declare that the research was conducted in the absence of any commercial or financial relationships that could be construed as a potential conflict of interest.

Figures

FIGURE 1
FIGURE 1
Physiological characteristics of ‘Crimson’ watermelon fruit. (A) The appearance of ‘Crimson’ at four key development stages (10, 18, 26, and 34 DAP). (B–E) Fruit weight, TSS content (Brix%), flesh firmness, and pH during different development stages of ‘Crimson’ watermelon fruit, respectively. And each stage of these four agronomic traits took three biological replicates.
FIGURE 2
FIGURE 2
The analysis results of the metabolic profiles obtained by LC–MS during the development of watermelon fruit. (A) Principal component analysis (PCA) score plot of all metabolites in 12 samples. KL1, KL2, KL3, and KL4 represent the samples at 10, 18, 26, and 34 days after pollination, respectively (DAP). The samples with the same color represent three biological replications of the same period. (B) Pie chart of the classification of 443 metabolites. (C) The number of differentially accumulation metabolites (DAMs) by comparing KL1 vs. KL2, KL2 vs. KL3, and KL3 vs. KL4. Green represents the number of up-regulated metabolites, On the contrary, orange stands for down-regulation. (D) Dynamics of Metabolite during four development stages. The bold black line represents the average pattern of all candidate metabolites in each class; the different colored lines represent different classes, and each line represents the average relative value of the metabolite over three biological replicates.
FIGURE 3
FIGURE 3
Classification of volatile organic compounds (VOCs) detected by GC–MS and analysis of differential metabolites. (A) Pie chart of the classification of 74 VOCs. (B) Venn diagram of the number of differential accumulation VOCs by comparing KL1 vs. KL2, KL2 vs. KL3, and KL3 vs. KL4. (C) Hierarchical clustering heat map of 23 differential accumulation VOCs in 12 samples, KL1, KL2, KL3, and KL4 represent the samples at 10, 18, 26, and 34 DAP, and -1, -2, and -3 represent different samples from the same period.
FIGURE 4
FIGURE 4
The expression profile of important regulatory genes and the accumulation patterns of sugars in the glycolytic pathway during four important developmental periods. In the color scale, each cube metabolized the average of three replicates in the same period. The metabolite data were standardized by the logarithm of 10, and the gene was the logarithm of 2; red or orange represents a higher relative content, but blue or green represents a lower relative content, from left to right represents the average relative content of metabolites at 10, 18, 26, and 34 DAP, respectively. The red triangle represents that the enriched genes in class 4 and class 5 are in the K-means clustering analysis, showing a tendency of up-regulation.
FIGURE 5
FIGURE 5
Accumulation patterns of C6 and C9 alcohols/aldehydes synthesized by lipoxygenase pathway and expression patterns of key genes. LOX, lipoxygenase; ADH, alcohol dehydrogenase; ISO, isomerase. In the color scale, each cube metabolized the average of three replicates in the same period. The metabolite data were standardized by the logarithm of 10, and the gene was the logarithm of 2; red and orange represent a higher relative content, and blue represents a lower relative content. From left to right represents the average relative expression of metabolites at 10, 18, 26, 34 DAP, respectively. The gene expression profile information is shown in Supplementary Table 6.

Similar articles

Cited by

References

    1. Barrett D. M., Beaulieu J. C., Shewfelt R. (2010). Color, flavor, texture, and nutritional quality of fresh-cut fruits and vegetables: desirable levels, instrumental and sensory measurement, and the effects of processing. Crit. Rev. Food Sci. Nutr. 50 369–389. 10.1080/10408391003626322 - DOI - PubMed
    1. Bianchi G., Provenzi L., Rizzolo A. (2020). Evolution of volatile compounds in ‘Cuoredolce§’ and ‘Rugby’ mini- watermelons (Citrullus lanatus (Thunb.) Matsumura and Nakai) in relation to ripening at harvest. J. Sci. Food Agric. 100 945–952. 10.1002/jsfa.10023 - DOI - PubMed
    1. Chen H., Cao S., Jin Y., Tang Y., Qi H. (2016). The relationship between CmADHs and the diversity of volatile organic compounds of three aroma types of melon (Cucumis melo). Front. Physiol. 7:254. 10.3389/fphys.2016.00254 - DOI - PMC - PubMed
    1. Chen W., Gong L., Guo Z., Wang W., Zhang H., Liu X., et al. (2013). A novel integrated method for large-scale detection, identification, and quantification of widely targeted metabolites: application in the study of rice metabolomics. Mol. Plant 6 1769–1780. 10.1093/mp/sst080 - DOI - PubMed
    1. Dudareva N., Klempien A., Muhlemann J. K., Kaplan I. (2013). Biosynthesis, function and metabolic engineering of plant volatile organic compounds. New Phytol. 198 16–32. 10.1111/nph.12145 - DOI - PubMed