

The Role of Visual Features in Text-Based CAPTCHAs: An fNIRS Study for Usable Security
- PMID: 34054941
- PMCID: PMC8112922
- DOI: 10.1155/2021/8842420
The Role of Visual Features in Text-Based CAPTCHAs: An fNIRS Study for Usable Security
Abstract
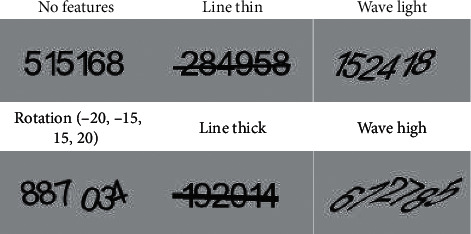
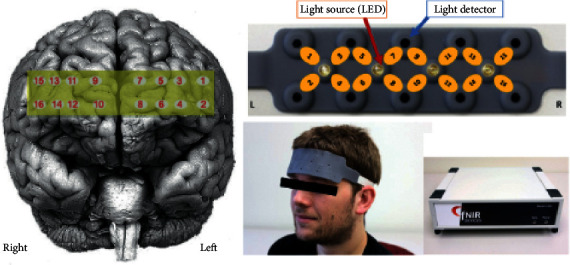
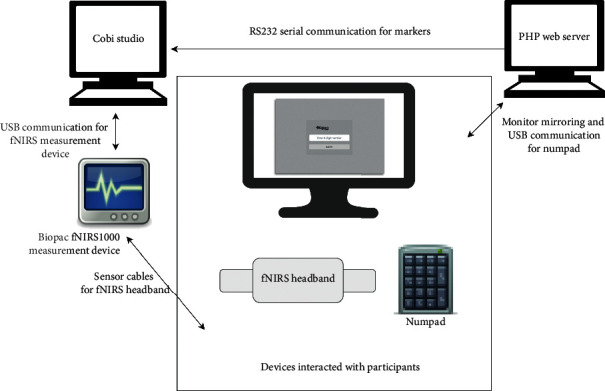
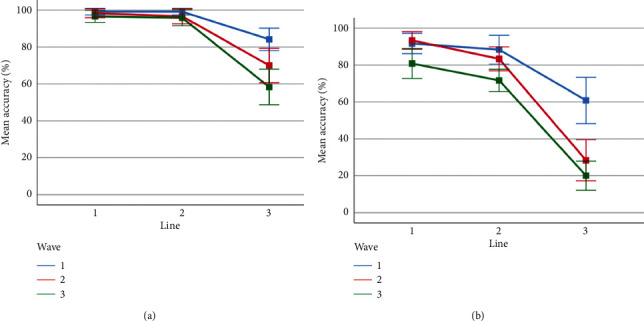
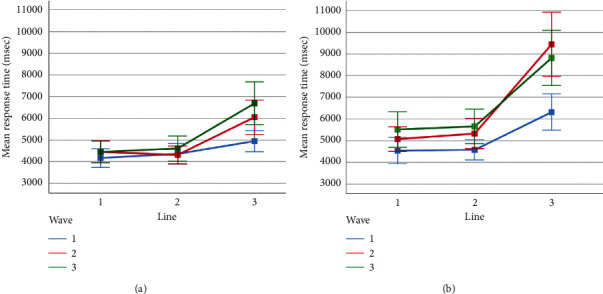
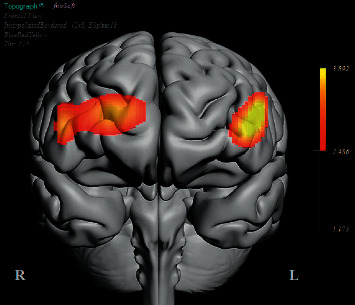
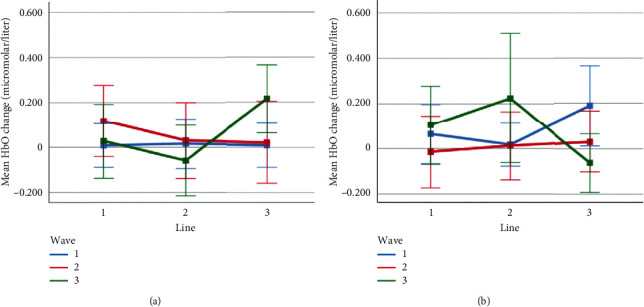
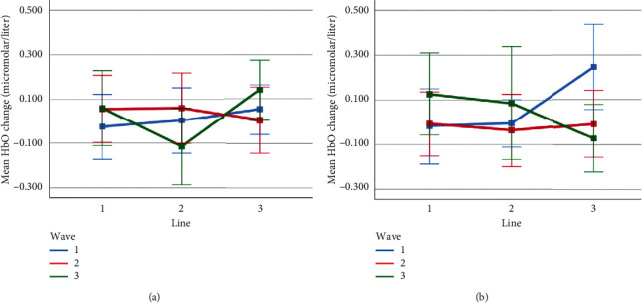
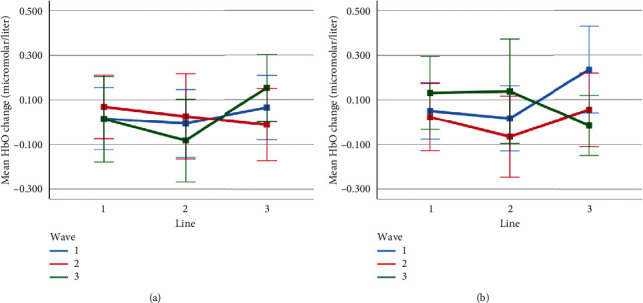
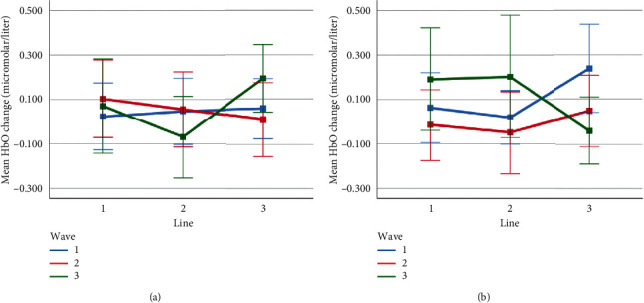
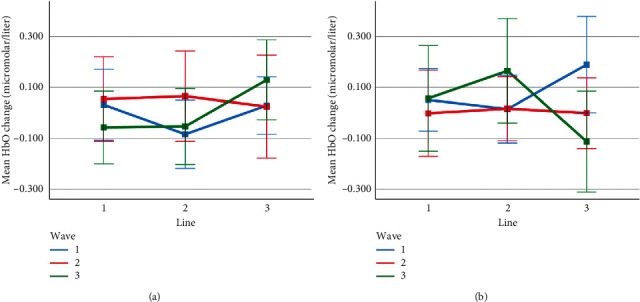
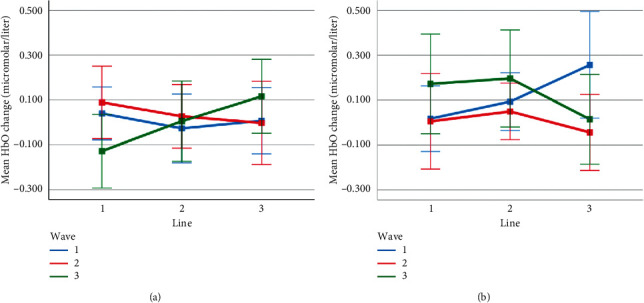
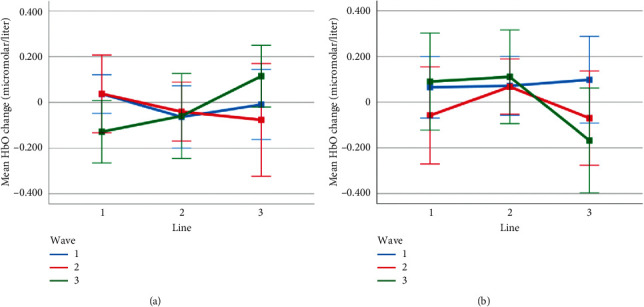
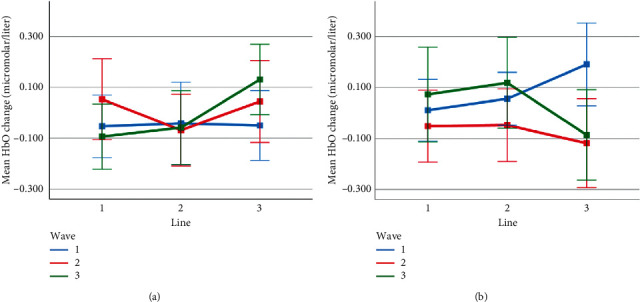
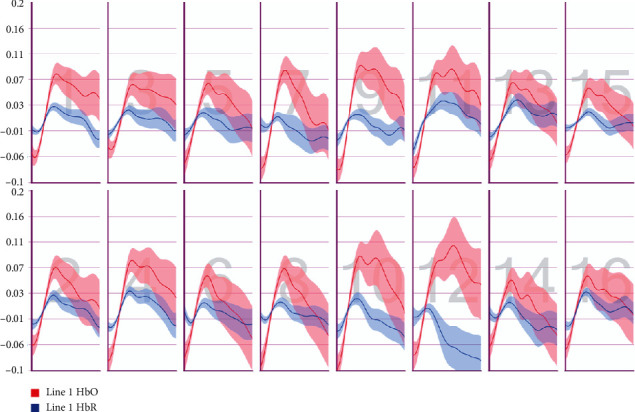
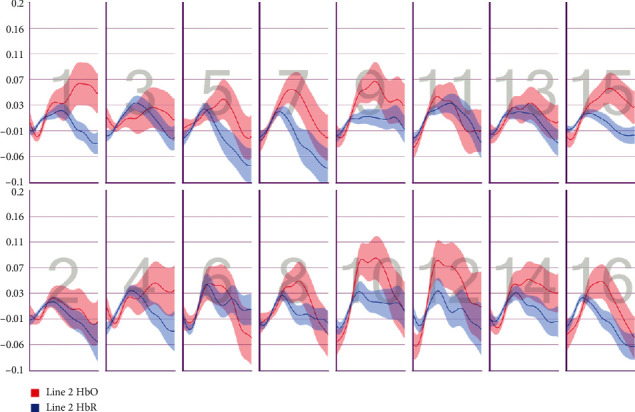
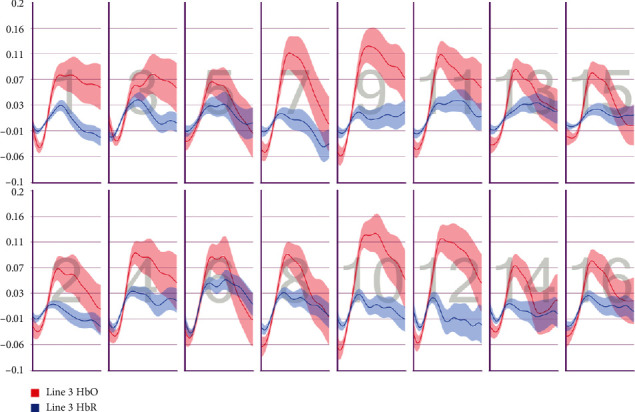
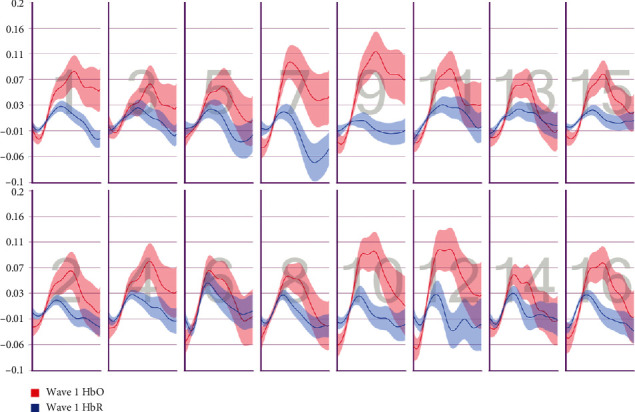
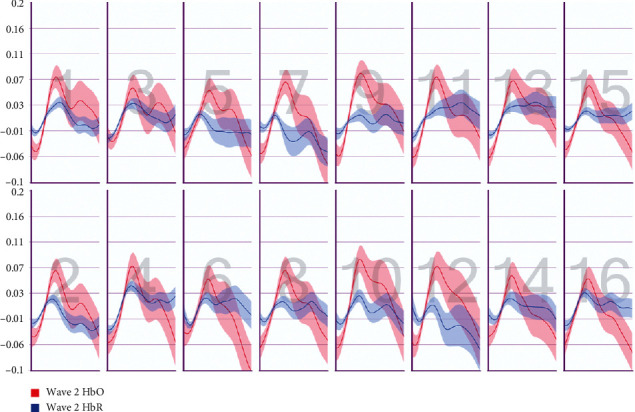
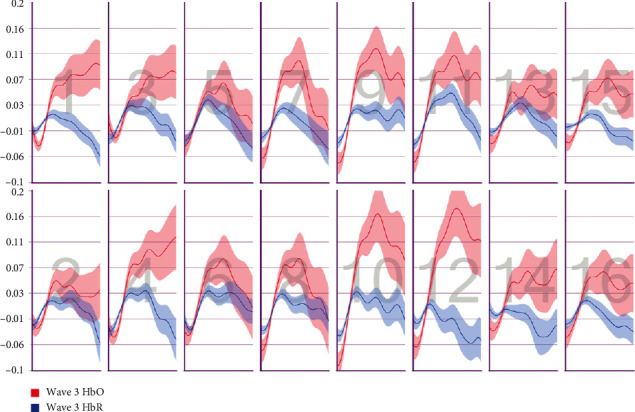
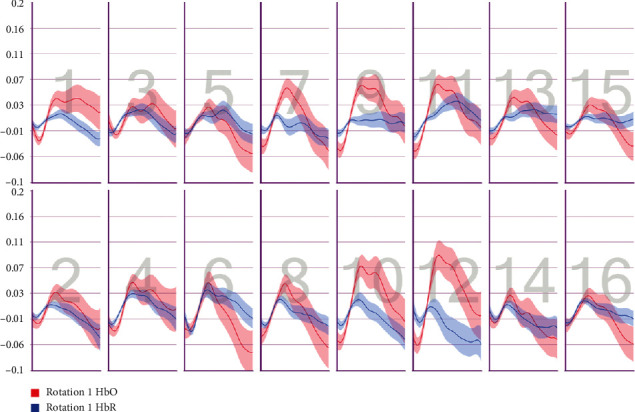
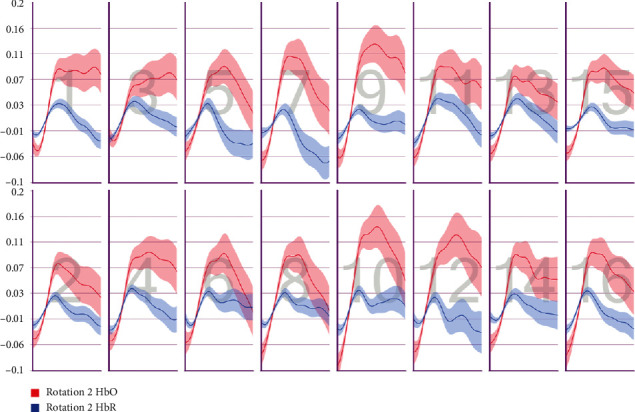
To mitigate dictionary attacks or similar undesirable automated attacks to information systems, developers mostly prefer using CAPTCHA challenges as Human Interactive Proofs (HIPs) to distinguish between human users and scripts. Appropriate use of CAPTCHA requires a setup that balances between robustness and usability during the design of a challenge. The previous research reveals that most usability studies have used accuracy and response time as measurement criteria for quantitative analysis. The present study aims at applying optical neuroimaging techniques for the analysis of CAPTCHA design. The functional Near-Infrared Spectroscopy technique was used to explore the hemodynamic responses in the prefrontal cortex elicited by CAPTCHA stimulus of varying types. The findings suggest that regions in the left and right dorsolateral and right dorsomedial prefrontal cortex respond to the degrees of line occlusion, rotation, and wave distortions present in a CAPTCHA. The systematic addition of the visual effects introduced nonlinear effects on the behavioral and prefrontal oxygenation measures, indicative of the emergence of Gestalt effects that might have influenced the perception of the overall CAPTCHA figure.
Copyright © 2021 Emre Mülazimoğlu et al.
Conflict of interest statement
The authors declare that there are no conflicts of interest regarding the publication of this manuscript.
Figures
Similar articles
-
New Cognitive Deep-Learning CAPTCHA.Sensors (Basel). 2023 Feb 20;23(4):2338. doi: 10.3390/s23042338. Sensors (Basel). 2023. PMID: 36850935 Free PMC article.
-
Adversarial CAPTCHAs.IEEE Trans Cybern. 2022 Jul;52(7):6095-6108. doi: 10.1109/TCYB.2021.3071395. Epub 2022 Jul 4. IEEE Trans Cybern. 2022. PMID: 34033564
-
FR-CAPTCHA: CAPTCHA based on recognizing human faces.PLoS One. 2014 Apr 15;9(4):e91708. doi: 10.1371/journal.pone.0091708. eCollection 2014. PLoS One. 2014. PMID: 24736523 Free PMC article.
-
Light up ADHD: I. Cortical hemodynamic responses measured by functional Near Infrared Spectroscopy (fNIRS): Special Section on "Translational and Neuroscience Studies in Affective Disorders" Section Editor, Maria Nobile MD, PhD. This Section of JAD focuses on the relevance of translational and neuroscience studies in providing a better understanding of the neural basis of affective disorders. The main aim is to briefly summarise relevant research findings in clinical neuroscience with particular regards to specific innovative topics in mood and anxiety disorders.J Affect Disord. 2018 Jul;234:358-364. doi: 10.1016/j.jad.2017.11.087. Epub 2017 Nov 21. J Affect Disord. 2018. PMID: 29195758 Review.
-
Functional near infra-red spectroscopy (fNIRS) in schizophrenia: A review.Asian J Psychiatr. 2017 Jun;27:18-31. doi: 10.1016/j.ajp.2017.02.009. Epub 2017 Feb 16. Asian J Psychiatr. 2017. PMID: 28558892 Review.
References
-
- OWASP T. Top 10-2017 the ten most critical web application security risks. 2017. https://owasp.org/www-project-top-ten/
-
- Ahn L. V., Blum M., Hopper N. J., Langford J. The official CAPTCHA site. 2000. http://www.captcha.net.
-
- Chew M., Tygar J. D. Image recognition captchas. Proceedings of the International Conference on Information Security; November 2004; Shanghai, China. pp. 268–279. - DOI
-
- Chen J., Luo X., Guo Y., Zhang Y., Gong D. A survey on breaking technique of text-based CAPTCHA. Security and Communication Networks. 2017;2017:15. doi: 10.1155/2017/6898617.6898617 - DOI
MeSH terms
LinkOut - more resources
Full Text Sources
