

The landscape of tumors-infiltrate immune cells in papillary thyroid carcinoma and its prognostic value
- PMID: 34055497
- PMCID: PMC8142931
- DOI: 10.7717/peerj.11494
The landscape of tumors-infiltrate immune cells in papillary thyroid carcinoma and its prognostic value
Abstract
Introduction: Thyroid cancer is a very common malignant tumor in the endocrine system, while the incidence of papillary thyroid carcinoma (PTC) throughout the world also shows a trend of increase year by year. In this study, we constructed two models: ICIscore and Riskscore. Combined with these two models, we can make more accurate and reasonable inferences about the prognosis of PTC patients.
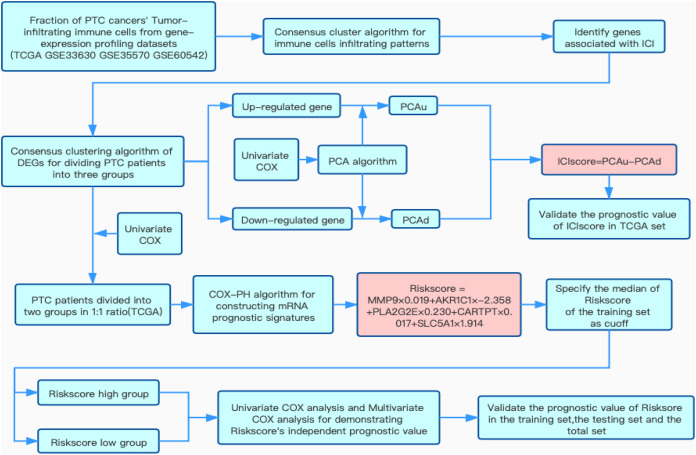
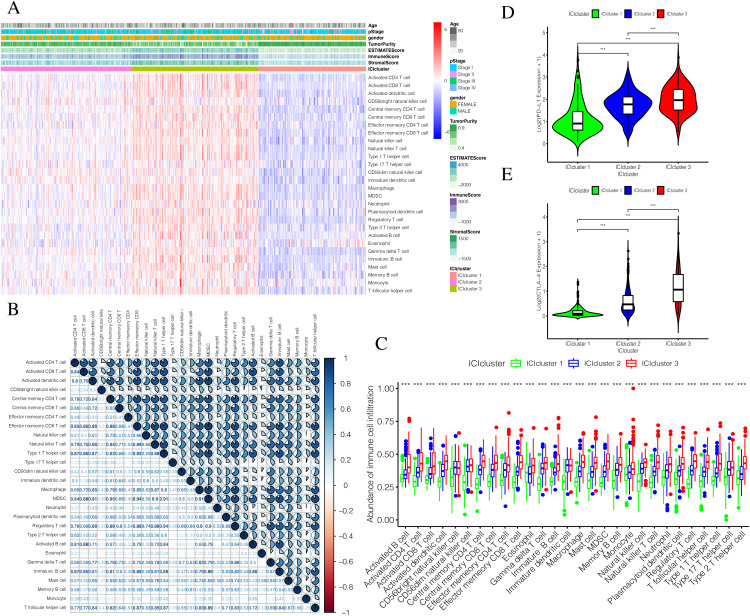
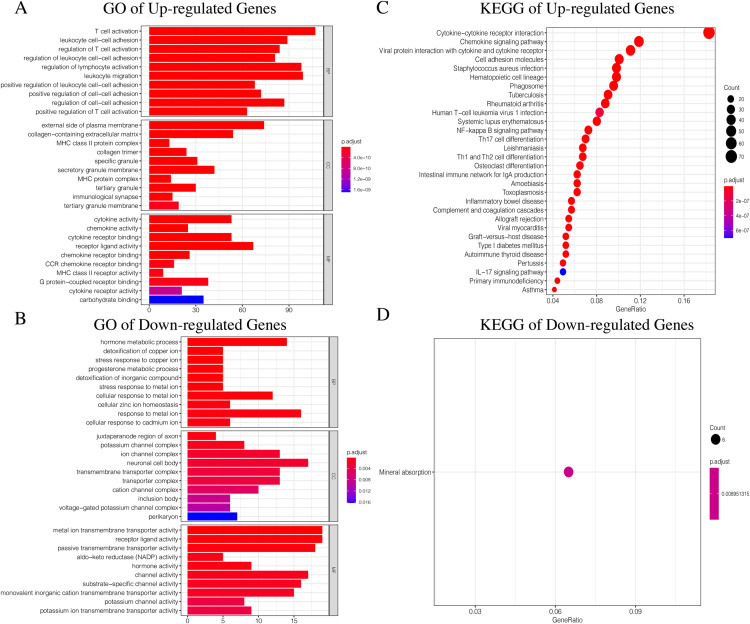
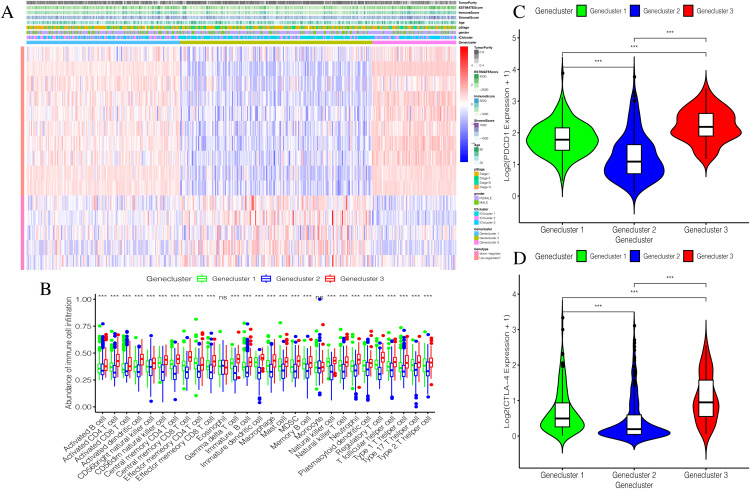
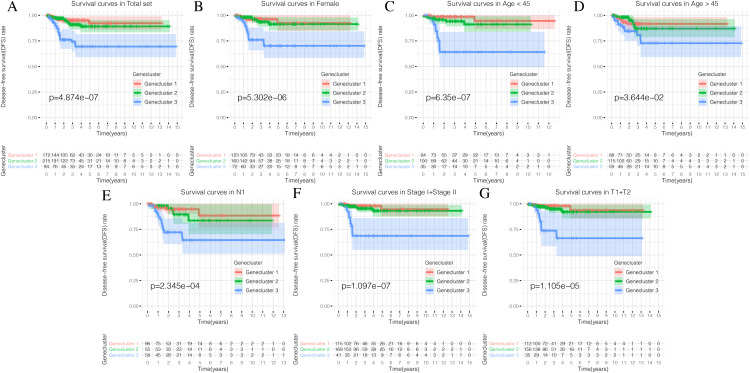
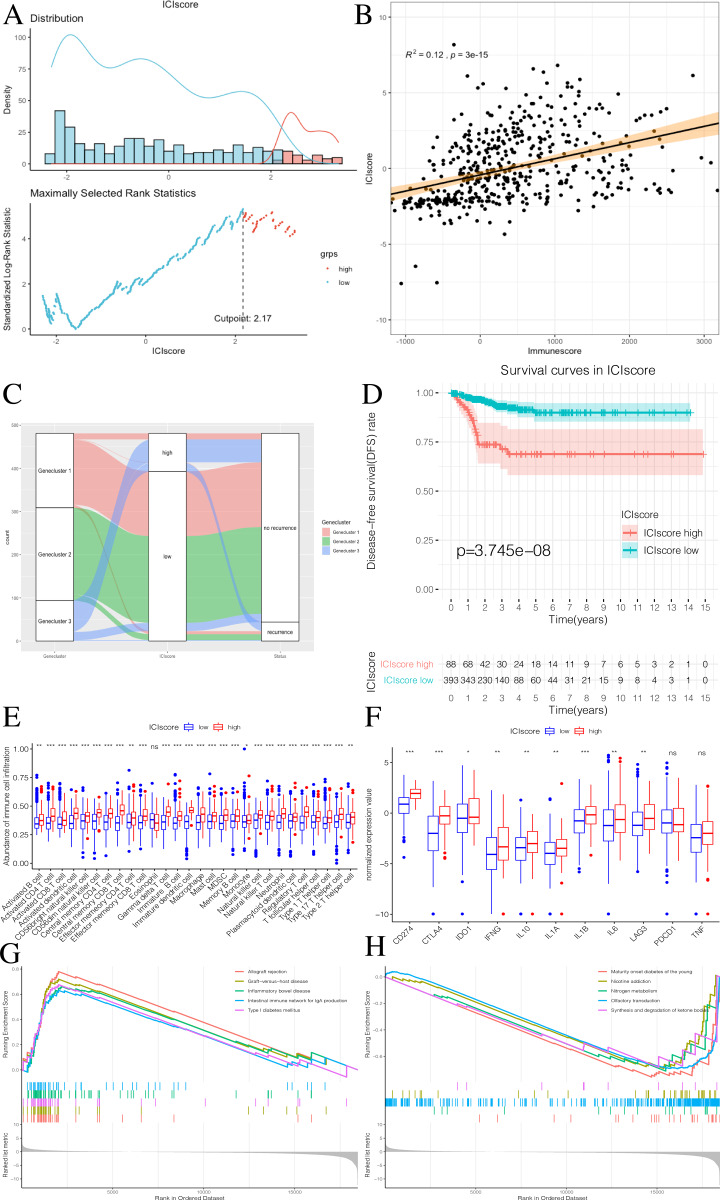
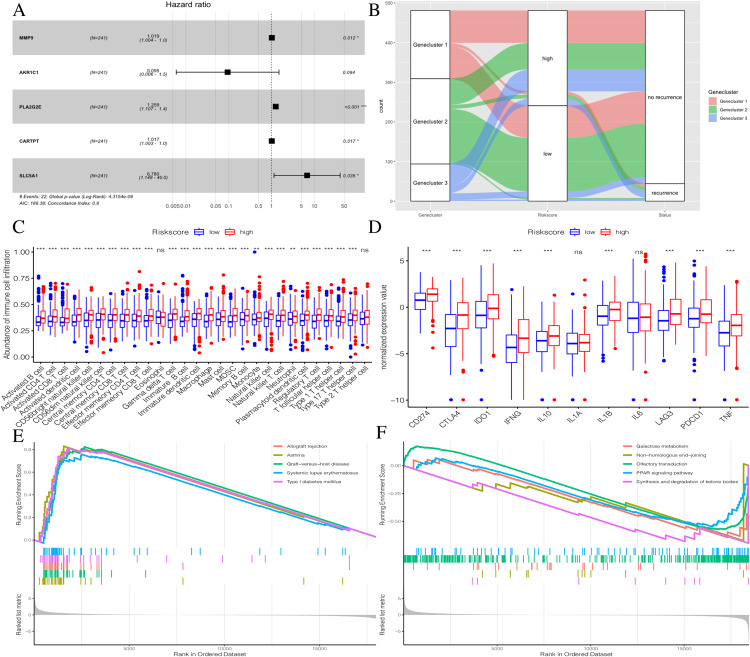
Methods: We selected 481 PTC samples from TCGA and 147 PTC samples from GEO (49 samples in GSE33630, 65 samples in GSE35570 and 33 samples in GSE60542). We performed consistent clustering for them and divided them into three subgroups and screened differentially expressed genes from these three subgroups. Then we divided the differential genes into three subtypes. We also distinguished the up-regulated and down-regulated genes and calculated ICIscore for each PTC sample. ICIscore consists of two parts: (1) the PCAu was calculated from up-regulated genes. (2) the PCAd was calculated from down-regulated genes. The PCAu and PCAd of each sample were the first principal component of the relevant gene. What's more, we divided the patients into two groups and constructed mRNA prognostic signatures. Additionally we also verified the independent prognostic value of the signature.
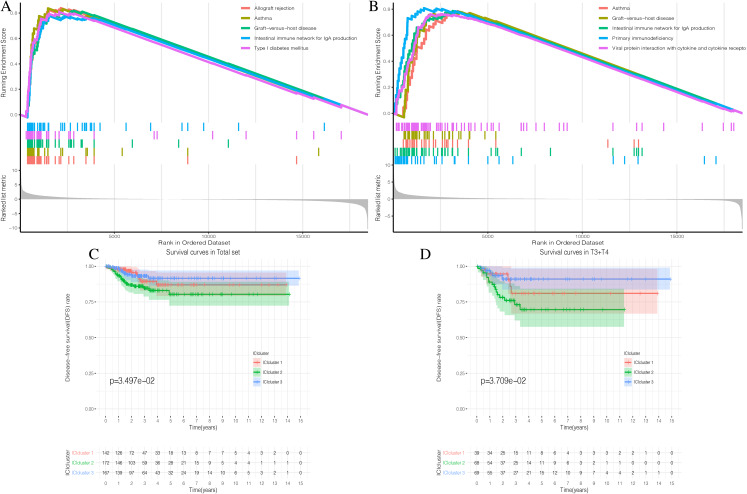
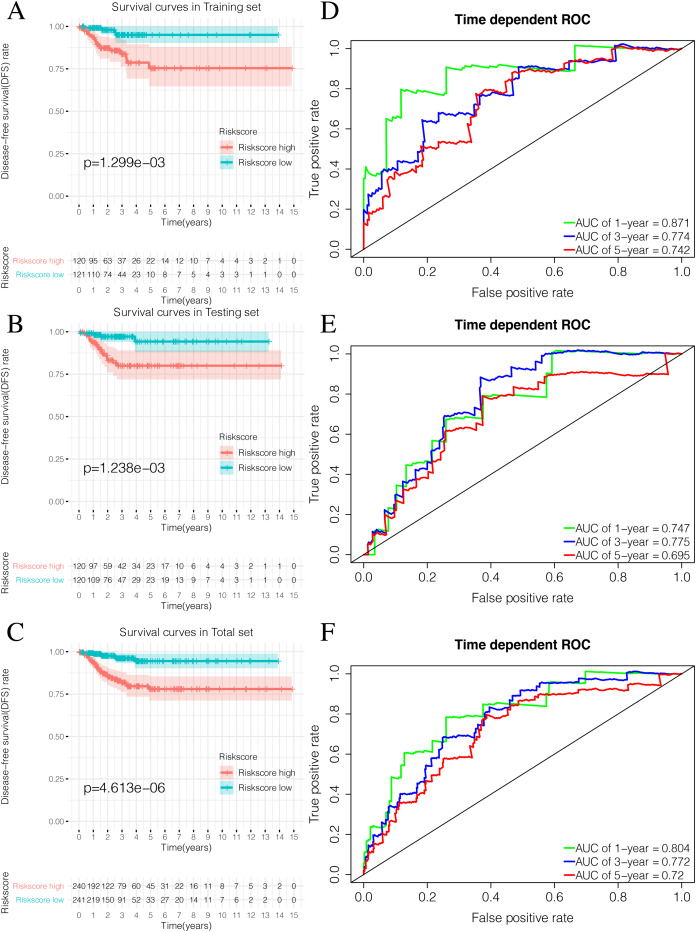
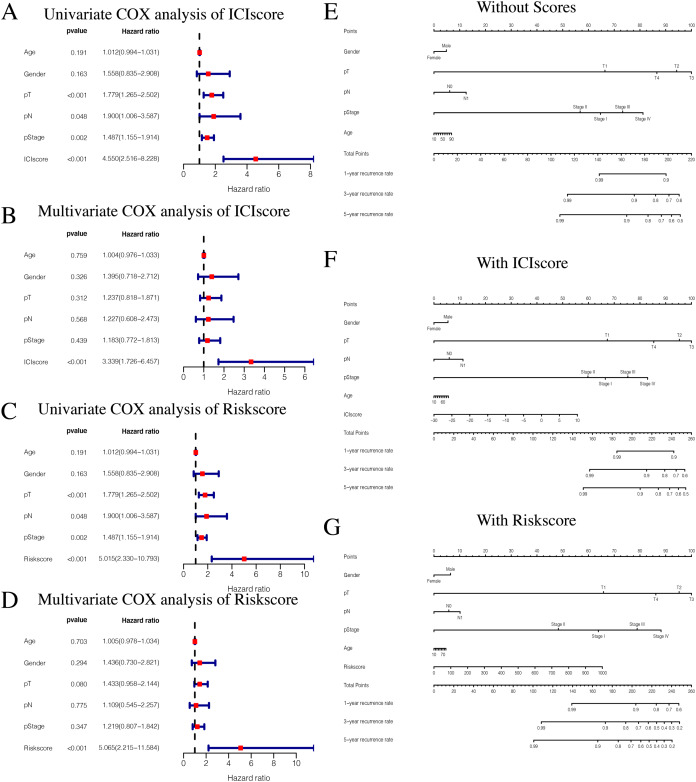
Results: Though ICIscore, we were able to observe the relationship between immune infiltration and prognosis. The result suggests that the activation of the immune system may have both positive and negative consequences. Though Riskscore, we could make more accurate predictions about the prognosis of patients with PTC. Meanwhile, we also generated and validated the ICIscore group and Riskscore group respectively.
Conclusion: All the research results show that by combining the two models constructed, ICIscore and Riskscore, we can make a more accurate and reasonable inference about the prognosis of patients with clinical PTC patients. This suggests that we can provide more effective and reasonable treatment plan for clinical PTC patients.
Keywords: Papillary thyroid carcinoma; Prognostic model; Tumors-infiltrate immune cells.
© 2021 Huang et al.
Conflict of interest statement
The authors declare that they have no competing interests.
Figures
Similar articles
-
Identification of Transcriptional Pattern Related to Immune Cell Infiltration With Gene Co-Expression Network in Papillary Thyroid Cancer.Front Endocrinol (Lausanne). 2022 Feb 4;13:721569. doi: 10.3389/fendo.2022.721569. eCollection 2022. Front Endocrinol (Lausanne). 2022. PMID: 35185791 Free PMC article.
-
Identification of ferroptosis genes in immune infiltration and prognosis in thyroid papillary carcinoma using network analysis.BMC Genomics. 2021 Jul 27;22(1):576. doi: 10.1186/s12864-021-07895-6. BMC Genomics. 2021. PMID: 34315405 Free PMC article.
-
Development and validation of a three-immune-related gene signature prognostic risk model in papillary thyroid carcinoma.J Endocrinol Invest. 2021 Oct;44(10):2153-2163. doi: 10.1007/s40618-021-01514-7. Epub 2021 Feb 23. J Endocrinol Invest. 2021. PMID: 33620716
-
Identification and Validation of Core Genes Involved in the Development of Papillary Thyroid Carcinoma via Bioinformatics Analysis.Int J Genomics. 2019 Sep 8;2019:5894926. doi: 10.1155/2019/5894926. eCollection 2019. Int J Genomics. 2019. PMID: 31583243 Free PMC article.
-
Development of a prognostic index based on an immunogenomic landscape analysis of papillary thyroid cancer.Aging (Albany NY). 2019 Jan 20;11(2):480-500. doi: 10.18632/aging.101754. Aging (Albany NY). 2019. PMID: 30661062 Free PMC article.
Cited by
-
Identification of Transcriptional Pattern Related to Immune Cell Infiltration With Gene Co-Expression Network in Papillary Thyroid Cancer.Front Endocrinol (Lausanne). 2022 Feb 4;13:721569. doi: 10.3389/fendo.2022.721569. eCollection 2022. Front Endocrinol (Lausanne). 2022. PMID: 35185791 Free PMC article.
References
-
- Ayers M, Lunceford J, Nebozhyn M, Murphy E, Loboda A, Kaufman DR, Albright A, Cheng JD, Kang SP, Shankaran V, Piha-Paul SA, Yearley J, Seiwert TY, Ribas A, McClanahan TK. IFN-γ-related mRNA profile predicts clinical response to PD-1 blockade. Journal of Clinical Investigation. 2017;127(8):2930–2940. doi: 10.1172/JCI91190. - DOI - PMC - PubMed
LinkOut - more resources
Full Text Sources
Other Literature Sources
