. 2021 May 13:9:650817.
doi: 10.3389/fcell.2021.650817. eCollection 2021.

Ecm29-Dependent Proteasome Localization Regulates Cytoskeleton Remodeling at the Immune Synapse

Affiliations

Ecm29-Dependent Proteasome Localization Regulates Cytoskeleton Remodeling at the Immune Synapse

Jorge Ibañez-Vega et al. Front Cell Dev Biol. .

Abstract

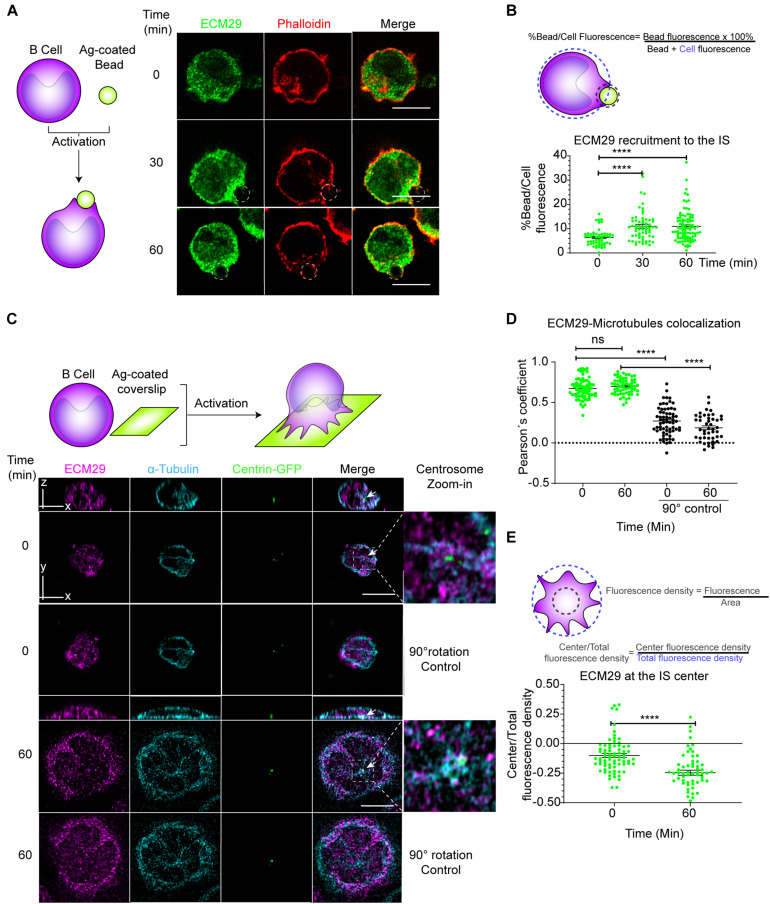
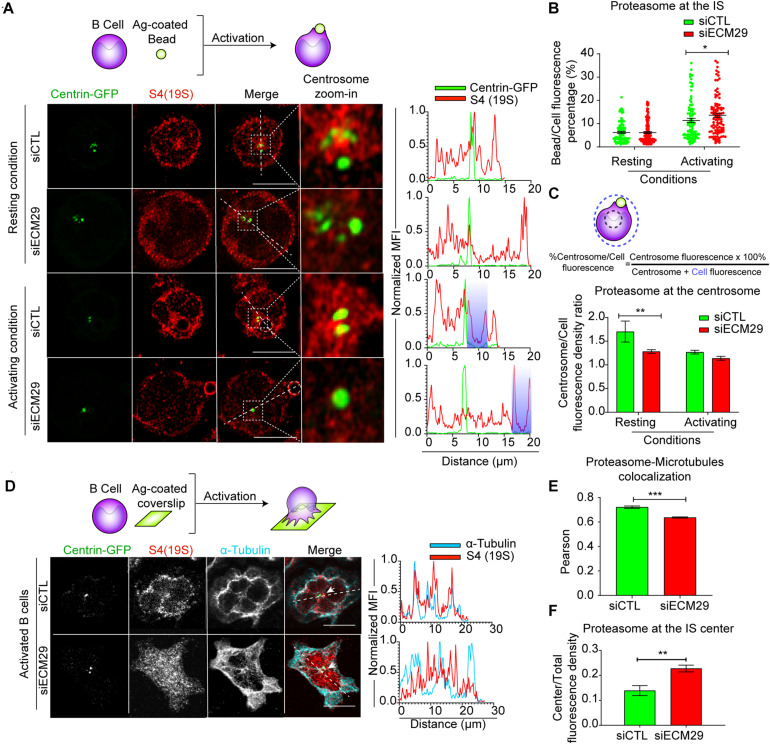
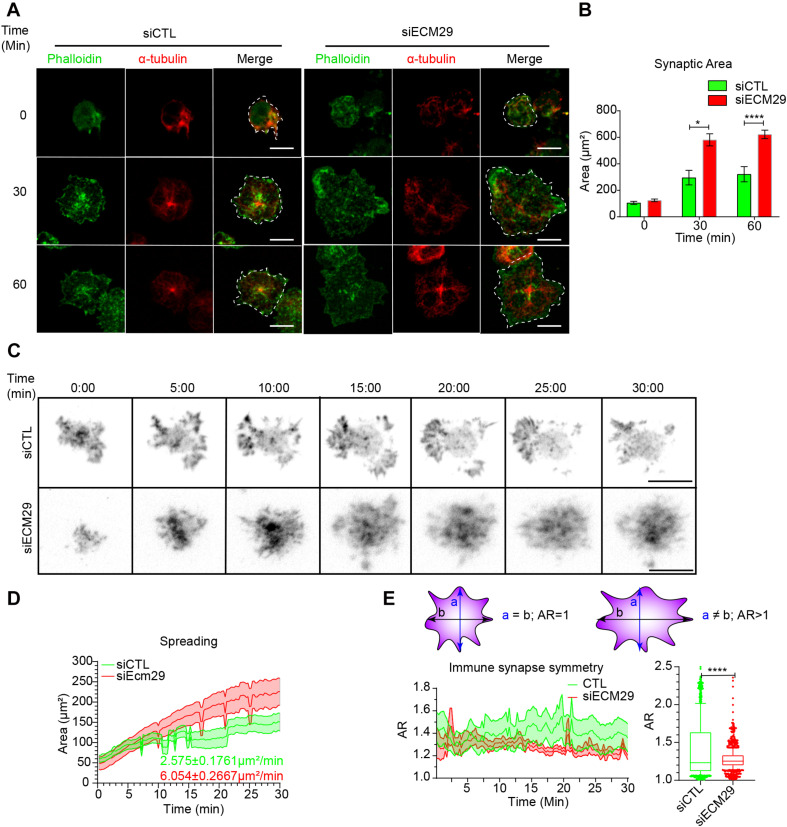
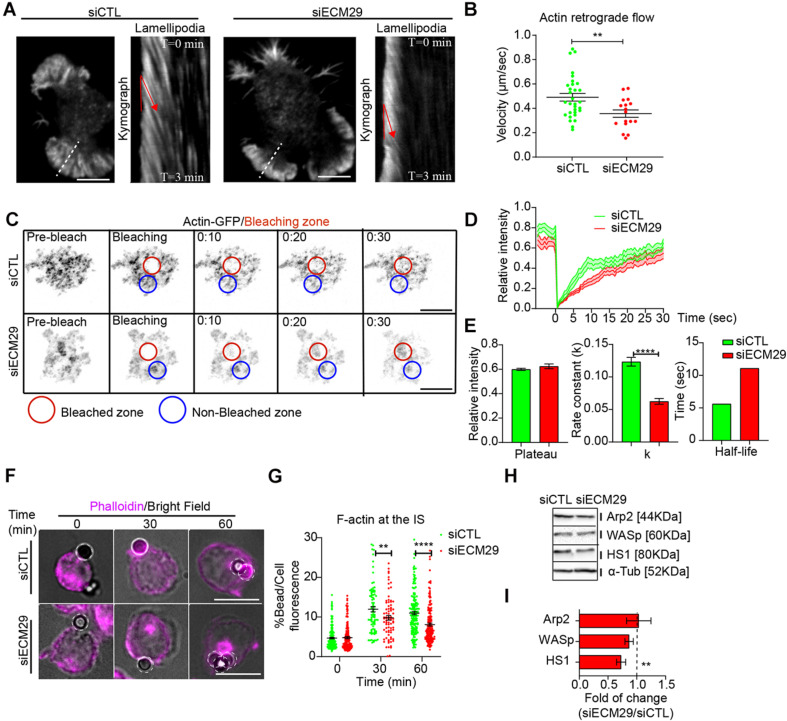
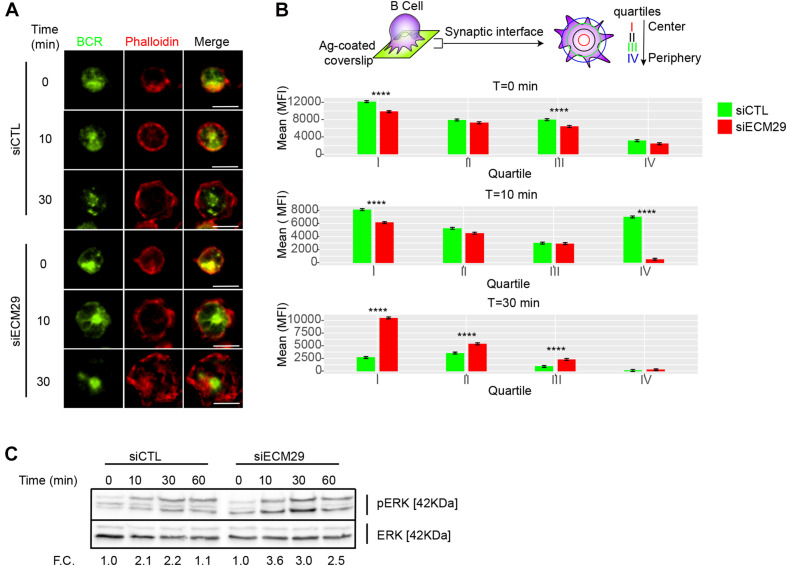
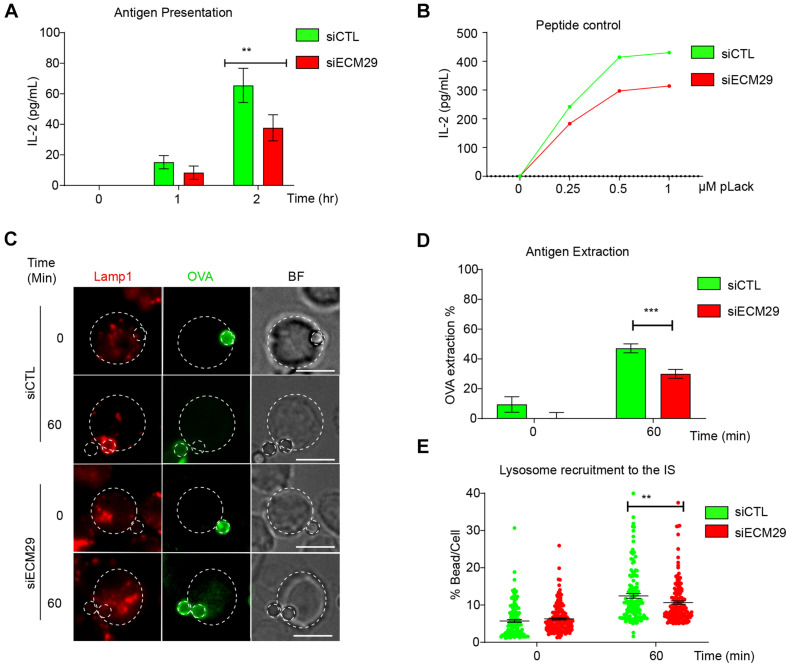
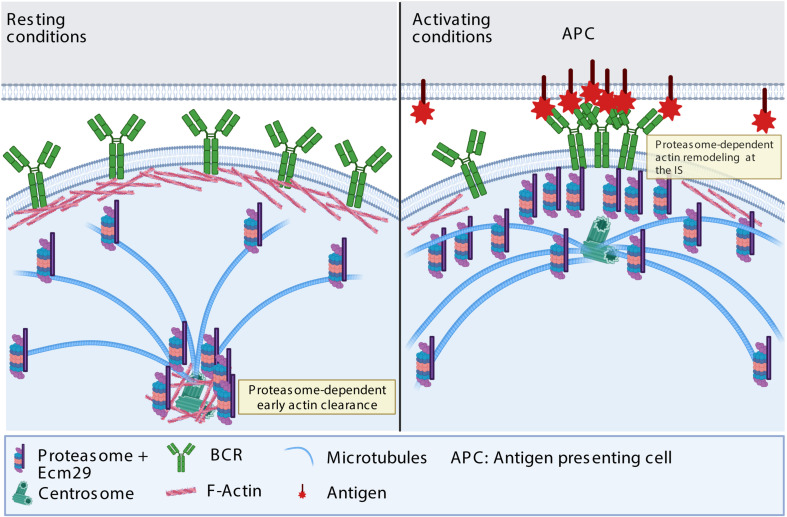
The formation of an immune synapse (IS) enables B cells to capture membrane-tethered antigens, where cortical actin cytoskeleton remodeling regulates cell spreading and depletion of F-actin at the centrosome promotes the recruitment of lysosomes to facilitate antigen extraction. How B cells regulate both pools of actin, remains poorly understood. We report here that decreased F-actin at the centrosome and IS relies on the distribution of the proteasome, regulated by Ecm29. Silencing Ecm29 decreases the proteasome pool associated to the centrosome of B cells and shifts its accumulation to the cell cortex and IS. Accordingly, Ecm29-silenced B cells display increased F-actin at the centrosome, impaired centrosome and lysosome repositioning to the IS and defective antigen extraction and presentation. Ecm29-silenced B cells, which accumulate higher levels of proteasome at the cell cortex, display decreased actin retrograde flow in lamellipodia and enhanced spreading responses. Our findings support a model where B the asymmetric distribution of the proteasome, mediated by Ecm29, coordinates actin dynamics at the centrosome and the IS, promoting lysosome recruitment and cell spreading.

Keywords: B cell; Ecm29; actin cytoskeleton; immune synapse; lysosomes; microtubules; proteasome.


Conflict of interest statement

The authors declare that the research was conducted in the absence of any commercial or financial relationships that could be construed as a potential conflict of interest.

Figures

FIGURE 1
FIGURE 1
Ecm29 co-localizes with microtubules and the centrosome and is recruited to the IS of B cells: (A) Scheme depicting activation of B cells with antigen-coated beads and representative Airyscan images of B cells activated for different time points (0, 30, and 60 min), labeled for actin (phalloidin) and Ecm29. Dashed white circles represent the bead. (B) Quantification scheme and quantification of Ecm29 recruitment at the immune synapse (Bead) after different time points of activation. N = 4. Cells > 54. (C) Scheme depicting activation of B cells onto antigen-coated coverslips. Representative Airyscan images of centrin-GFP expressing B cells in resting (0 min) and activating (60 min) conditions, labeled for Ecm29 (magenta), microtubules (α-tubulin, cyan). White arrows indicate the centrosome. Magnifications of centrosome areas (9 μm2) are shown. 90°channel rotation control is shown for both time points (Means: 0,27 and 0,18 for 0 and 60 min of activation, respectively). (D,E) Quantification of the colocalization of Ecm29 with microtubules and its accumulation at the IS center (see scheme) from experiment shown in C. N = 2. Cells > 61. ****p < 0.0001. Kruskal–Wallis test with Dunn’s test, and Mann–Whitney test was performed for all statistical analyses. Mean with SEM bars are shown. Scale bar = 10 μm. ns, non-significant.
FIGURE 2
FIGURE 2
Ecm29 regulates proteasome localization at the centrosome and microtubules: (A) Top: Schematic representation of B cells activated with antigen-coated beads. Representative confocal images of centrin-GFP expressing control (siCTL) and Ecm29-silenced (siECM29) B cells in resting (0 min) or activating (60 min) conditions, labeled for 19S[S4] (red). Magnifications of the centrosome area (3 μm2) are shown. Fluorescence intensity distributions of centrin-GFP (green) and S4(19S) (red) across the cell (dashed white lines) are shown on the right. White dashed circles and shaded areas represent the bead and the centrosome area, respectively. (B,C) Scheme and quantification of proteasome enrichment at the centrosome and the bead in (A), respectively. N = 4. Cells > 97. (D) Schematic representation of B cells activated onto antigen-coated coverslips. Representative confocal images of centrin-GFP expressing control and Ecm29-silenced B cells after 60 min of activation, labeled for 19S[S4] and α-tubulin. The fluorescence intensity distributions of α-tubulin (blue) and S4(19S) (red) across the cell (dashed white lines) are shown. White arrows indicate the centrosome. (E,F) Quantification of proteasome colocalization with microtubules and proteasome recruitment at the IS center, respectively. N = 2. Cells > 53 and >48, respectively. *p < 0.05. **p < 0.01. ***p < 0.001. Kruskal–Wallis test with Dunn’s test, and Mann–Whitney test was performed for all statistical analyses. Mean with SEM bars are shown. Scale bar = 10 μm.
FIGURE 3
FIGURE 3
Ecm29 silencing enhances B cell spreading responses: (A) Representative confocal images of control (siCTL) and Ecm29-silenced (siECM29) B cells activated for different time points (0, 30, and 60 min), stained with phalloidin (green) and α-Tubulin (red) are shown. (B) Quantification of the spreading area in (A). N = 3. Cells > 40. (C) Representative Time-lapse images acquired by TIRFM of control and Ecm29-silenced B cells expressing LifeAct-mCherry (grayscale). (D,E) Quantification of the spreading area and aspect ratio (AR) and a schematic representation of AR values in (C), respectively. The mean spreading velocity and mean AR are shown. N = 10. *p < 0.05. ****p < 0.0001. Kruskal–Wallis test with Dunn’s test, and Mann-Whitney test was performed for all statistical analyses were performed. Mean with SEM bars (B), lines (D,E), and boxes and whiskers with 10% percentile (E) are shown. Scale bar = 10 μm.
FIGURE 4
FIGURE 4
Ecm29 silencing reduces actin dynamics and accumulation at the IS: (A) Representative TIRFM images of control (siCTL) and Ecm29-silenced (siECM29) B cells after 30 min of activation and their respective kymographs of lamellipodia (white dashed line). Red lines represent the actin retrograde flow angle. (B) Quantification of actin retrograde flow in (A). N = 17. (C) Time-lapse FRAP-TIRFM images of control and Ecm29-silenced B cells expressing Actin-GFP (grayscale) after 30 min of activation. Red and blue circles represent the bleached and non-bleached zone, respectively. (D,E) Quantification of Fluorescence Recovery After Photobleaching of Actin-GFP, and associated parameters (plateau, k, and half-life). N = 15. (F) Representative epifluorescence images of control and Ecm29-silenced B cells activated with antigen-coated beads for different time points, labeled for F-actin (Phalloidin) are shown. (G) Quantification of F-actin accumulation at the bead in F. N > 3. Cells > 80. (H) Representative immunoblot of control and Ecm29-silenced B cells. Arp2, WASp, HS1, and α-Tub are shown. (I) Quantification of protein levels in (E). N > 4. **p < 0.01. ****p < 0.0001. A Mann–Whitney was performed. Mean with SEMs and individual experiments (points) (A,G), and boxes with SEM (I) are shown. Scale bar = 10 μm.
FIGURE 5
FIGURE 5
Ecm29 silencing enhances BCR clustering and Erk phosphorylation: (A) Representative Epifluorescence images of control (siCTL) and Ecm29-silenced (siECM29) B cells, activated onto antigen-coated coverslips for different time points (0, 10, and 30 min), labeled for the BCR and F-actin (phalloidin). (B) Schematic representation of BCR distribution quantification, and the respective quantification of BCR accumulation in each quartile of the immune synapse in B cells shown in (A). N = 2. Cells > 30. (C) Immunoblot of protein of control and Ecm29-silenced B cells activated for different time points (0, 10, 30, and 60 min). Phosphorylated Erk (pErk) and total Erk (Erk) are shown. F.C., Fold of change respect time 0 min. ****p < 0.05. Kruskal–Wallis test with Dunn’s test was performed for all statistical analyses. Scale Bar = 10 μm.
FIGURE 6
FIGURE 6
Centrosome polarization and perinuclear actin clearance rely on Ecm29: (A) Representative X/Z confocal images of centrin-GFP expressing control (siCTL) and Ecm29-silenced (siECM29) B cells activated on antigen-coated coverslips for different time points, stained for F-actin, phalloidin are shown. White arrows indicate the centrosome. The white dashed line represents the position of the coverslip. (B,C) Quantification of centrosome fluorescence intensity along the Z dimension from the coverslip to the upper cell limit of control and Ecm29 silenced B cells, respectively. The green rectangle represents the synaptic Z area (between 1 and 2 Z-fraction), and the maximum value of the curve represents the localization of the centrosome in the Z dimension. N = 2. Cells > 19. (D) Representative Ayriscan images of centrin-GFP expressing control and Ecm29-silenced B cells activated on antigen-coated coverslips for different time points, labeled for F-actin, phalloidin. Magnifications of the centrosome (9 μm2) and the fluorescence intensity distribution of centrin-GFP (green) and phalloidin (red) across the cell (dashed white lines) are shown. White rectangles represent the X/Y position for images in Z. (E) Quantification of actin at the centrosome in D. N = 2. Cells > 45. *p < 0.05. Kruskal–Wallis test with Dunn’s test, and Mann–Whitney test was performed for all statistical analyses. was performed for all statistical analyses. Mean with SEM lines (B,C) and bars (E) are shown. Scale bar = 10 μm.
FIGURE 7
FIGURE 7
Efficient antigen extraction and presentation requires Ecm29: (A) Antigen presentation assay for control (siCTL) and Ecm29 silenced (siECM9) B cells. Levels of IL-2 by T cells were quantified by ELISA. N = 3. (B) Representative graph of peptide controls for cells used in antigen presentation assays. (C) Representative images of control and Ecm29 silenced B cells activated with beads coated with anti-IgG + OVA in resting (0 min) and activating conditions (60 min). Lysosomes (Lamp1) and antigen (OVA) are shown. The white dashed circles delimit cell boundaries and bead. (D,E) Quantification of antigen extraction, measured as the amount of OVA extracted from the bead, and lysosome recruitment to the bead in (C). N = 4. Cells > 82. **p < 0.01. ***p < 0.001. Kruskal–Wallis test with Dunn’s test, and Mann–Whitney test was performed for all statistical analyses was performed for all statistical analyses. Mean with SEM bars (A,D), individual cells (points) (E) are shown. Scale bar = 10 μm.
FIGURE 8
FIGURE 8
Proposed model: In resting conditions, Ecm29 enhances proteasome localization at the centrosome. Upon activation, Ecm29 regulates the distribution of the proteasome at the synaptic interface. The subcellular localization of the proteasome between the centrosome and the immune synapse regulates actin remodeling in both compartments. At the centrosome, the proteasome facilitates early actin clearance and therefore centrosome translocation at the synapse, whereas at the immune synapse, the proteasome enhances actin remodeling by reducing its stability, thereby promoting cell spreading, BCR clustering and signaling. Further studies are required to determine which actin regulatory proteins are degraded by the proteasome, upon B cell activation and contribute to actin remodeling.

Similar articles

Cited by

References

    1. Arganda-Carreras I., Kaynig V., Rueden C., Eliceiri K. W., Schindelin J., Cardona A., et al. (2017). Trainable weka segmentation: a machine learning tool for microscopy pixel classification. Bioinformatics 33 2424–2426. 10.1093/bioinformatics/btx180 - DOI - PubMed
    1. Babich A., Li S., O’Connor R. S., Milone M. C., Freedman B. D., Burkhardt J. K. (2012). F-actin polymerization and retrograde flow drive sustained PLCγ1 signaling during T cell activation. J. Cell Biol. 197 775–787. 10.1083/jcb.201201018 - DOI - PMC - PubMed
    1. Batista F. D., Treanor B., Harwood N. E. (2010). Visualizing a role for the actin cytoskeleton in the regulation of B-cell activation. Immunol. Rev. 237 191–204. 10.1111/j.1600-065X.2010.00943.x - DOI - PubMed
    1. Bellaiche Y., Gasman S., Desdouets C., Yuseff M.-I., Darchen F., Jauffred B., et al. (2011). Polarized secretion of lysosomes at the B cell synapse couples antigen extraction to processing and presentation. Immunity 35 361–374. 10.1016/j.immuni.2011.07.008 - DOI - PubMed
    1. Bolger-Munro M., Choi K., Scurll J. M., Abraham L., Chappell R. S., Sheen D., et al. (2019). Arp2/3 complex-driven spatial patterning of the BCR enhances immune synapse formation. BCR signaling and B cell activation. eLife 8:e44574. 10.7554/elife.44574 - DOI - PMC - PubMed

LinkOut - more resources