

Low-Contrast High-Pass Visual Acuity Might Help to Detect Glaucoma Damage: A Structure-Function Analysis
- PMID: 34055847
- PMCID: PMC8160221
- DOI: 10.3389/fmed.2021.680823
Low-Contrast High-Pass Visual Acuity Might Help to Detect Glaucoma Damage: A Structure-Function Analysis
Abstract
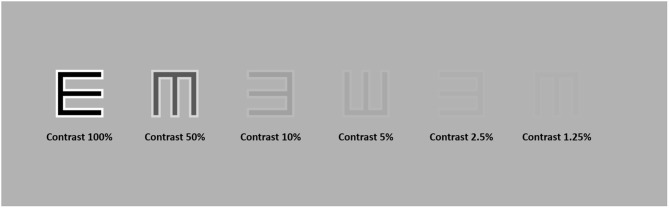
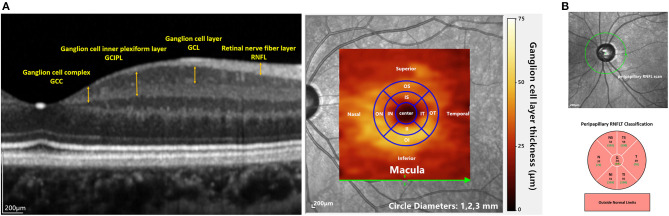
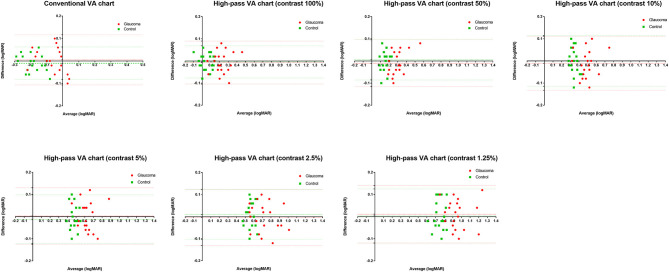
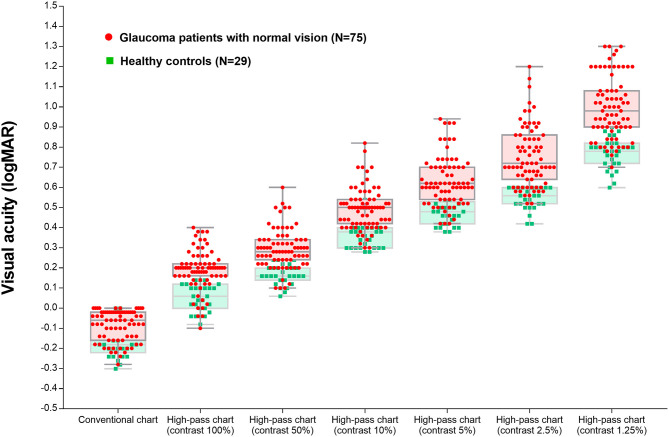
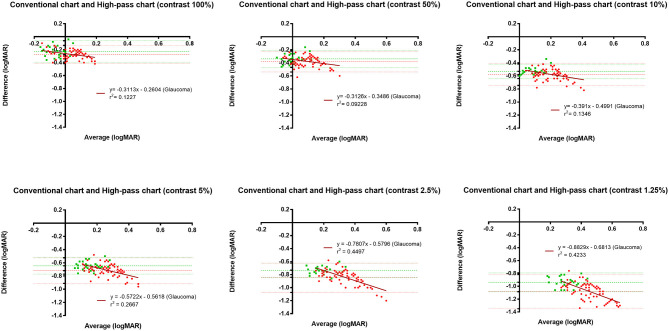
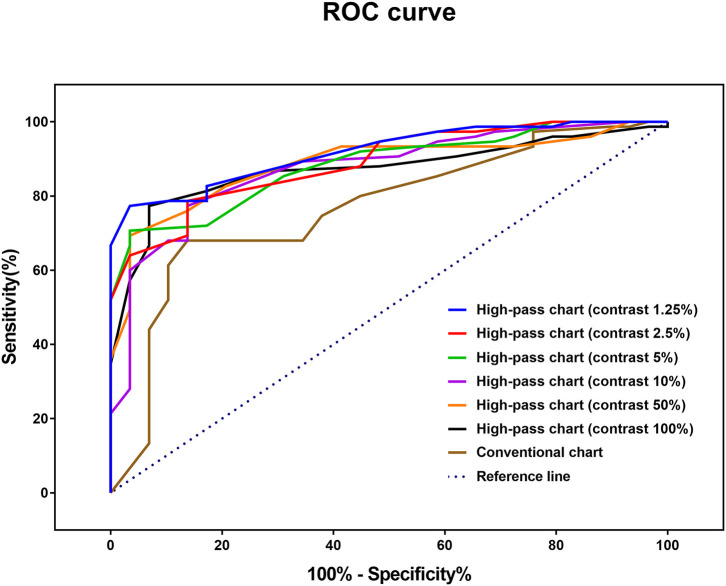
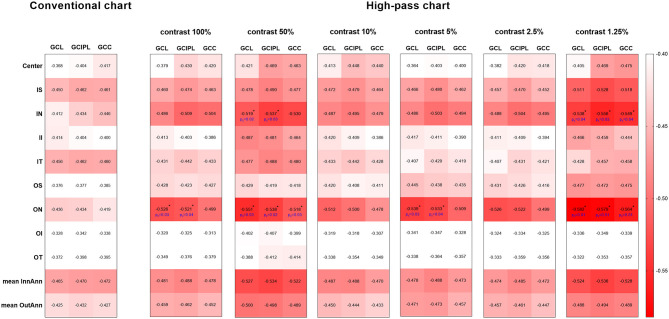
Purpose: The conventional visual acuity (VA) test is not sensitive enough to detect glaucoma macular damage. We aimed to investigate whether VA measurements using low-contrast high-pass optotypes are more sensitive to macular dysfunction in glaucoma and to find the potential structural basis of this difference. Methods: A total of 147 subjects were recruited, including 118 patients with glaucoma (mean age: 46.08 ± 14.64 years) and 29 healthy controls (mean age: 39.83 ± 9.81 years). For each participant, monocular best-corrected VA was measured using a conventional chart and six high-pass charts at 100, 50, 10, 5, 2.5, and 1.25% contrast levels, respectively. The macular retinal thickness and circumpapillary retinal nerve fiber layer (cpRNFL) thickness of all the glaucoma patients were obtained by spectral-domain optical coherence tomography (SD-OCT). Results: Compared with healthy subjects, glaucoma patients with normal vision demonstrated worse VAs in high-pass acuity measurements (0.22-0.93 vs. 0.28-1.08, p < 0.05). Receiver operating characteristic curve (ROC) showed that 1.25% low-contrast high-pass VA was optimal for discriminating between the controls and glaucoma patients (AUC: 0.918, p < 0.001; sensitivity: 77.33%; specificity: 96.55%). Compared with conventional VA, 1.25% high-pass VA correlated better with nasal-side macular retinal ganglion cell (RGC)-related parameters (r = -0.419 to -0.446 vs. r = -0.538 to -0.582; Fisher's Z transformation, p z < 0.05). There was no difference in the strength of correlations between the VAs measured using different charts and cpRNFL thickness (Fisher's Z transformation; p z > 0.05). Conclusions: VA measurement taken with low-contrast (1.25%) high-pass acuity chart is more sensitive in detecting central visual loss in glaucoma than that taken with the conventional chart. Macular RGC damage appears to be associated with low-contrast (1.25%) high-pass visual loss in glaucomatous eyes.
Keywords: glaucoma; high-pass optotypes; low-contrast visual acuity; macular damage; optical coherence tomography.
Copyright © 2021 Wen, Chen, Zuo, Yang, Xu, Kong, Cheng and Yu.
Conflict of interest statement
The authors declare that the research was conducted in the absence of any commercial or financial relationships that could be construed as a potential conflict of interest.
Figures
Similar articles
-
High-Pass Visual Acuity Loss and Macular Structure-Function Relationship in Patients With Primary Open-Angle Glaucoma.Transl Vis Sci Technol. 2021 Apr 1;10(4):26. doi: 10.1167/tvst.10.4.26. Transl Vis Sci Technol. 2021. PMID: 34004003 Free PMC article.
-
Relationship between visual acuity and retinal structures measured by spectral domain optical coherence tomography in patients with open-angle glaucoma.Invest Ophthalmol Vis Sci. 2014 Jul 17;55(8):4801-11. doi: 10.1167/iovs.13-13052. Invest Ophthalmol Vis Sci. 2014. PMID: 25034596
-
The ability of macular parameters and circumpapillary retinal nerve fiber layer by three SD-OCT instruments to diagnose highly myopic glaucoma.Invest Ophthalmol Vis Sci. 2013 Sep 5;54(9):6025-32. doi: 10.1167/iovs.13-12630. Invest Ophthalmol Vis Sci. 2013. PMID: 23908182
-
Diagnostic ability of macular ganglion cell inner plexiform layer measurements in glaucoma using swept source and spectral domain optical coherence tomography.PLoS One. 2015 May 15;10(5):e0125957. doi: 10.1371/journal.pone.0125957. eCollection 2015. PLoS One. 2015. PMID: 25978420 Free PMC article.
-
[Aiming for zero blindness].Nippon Ganka Gakkai Zasshi. 2015 Mar;119(3):168-93; discussion 194. Nippon Ganka Gakkai Zasshi. 2015. PMID: 25854109 Review. Japanese.
Cited by
-
Longitudinal Visual Biomarkers in Dominant Optic Atrophy: A Systematic Review and Meta-Analysis.Clin Exp Ophthalmol. 2025 Aug;53(6):652-659. doi: 10.1111/ceo.14543. Epub 2025 May 7. Clin Exp Ophthalmol. 2025. PMID: 40329928 Free PMC article. Review.
-
Preliminary Application of a Continuous Functional Contrast Visual Acuity System in the Assessment of Visual Function in Dry Eye Patients.Transl Vis Sci Technol. 2023 Dec 1;12(12):6. doi: 10.1167/tvst.12.12.6. Transl Vis Sci Technol. 2023. PMID: 38054930 Free PMC article.
References
LinkOut - more resources
Full Text Sources
Other Literature Sources