

Lipidomic and Transcriptomic Analysis of the Longissimus Muscle of Luchuan and Duroc Pigs
- PMID: 34055857
- PMCID: PMC8154583
- DOI: 10.3389/fnut.2021.667622
Lipidomic and Transcriptomic Analysis of the Longissimus Muscle of Luchuan and Duroc Pigs
Abstract
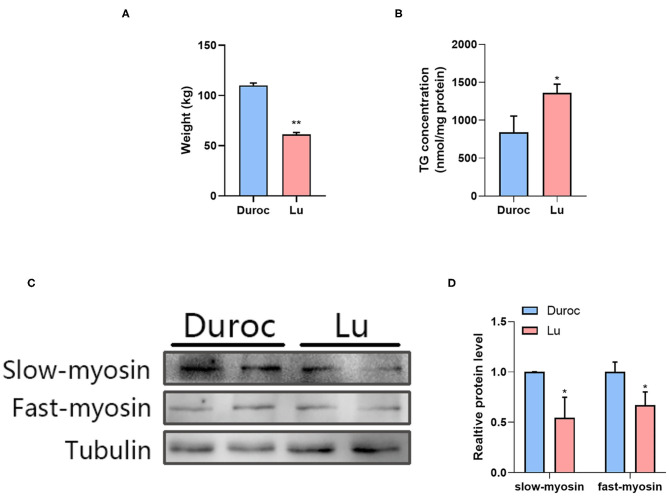
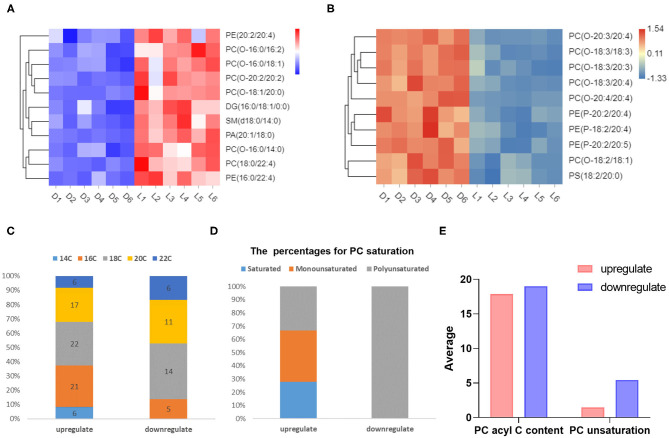
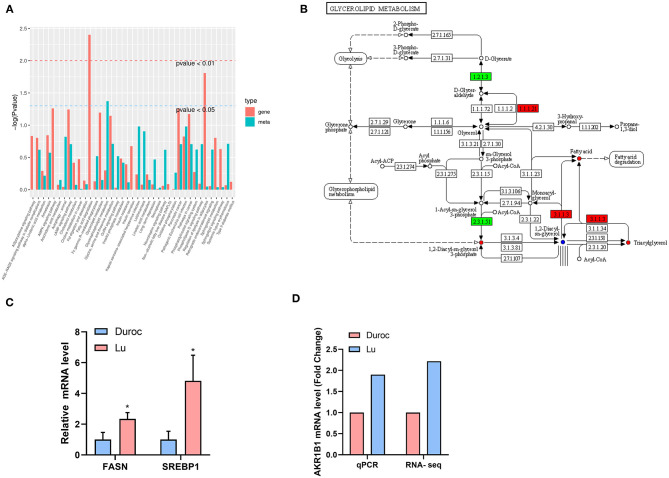
Meat is an essential food, and pork is the largest consumer meat product in China and the world. Intramuscular fat has always been the basis for people to select and judge meat products. Therefore, we selected the Duroc, a western lean pig breed, and the Luchuan, a Chinese obese pig breed, as models, and used the longissimus dorsi muscle for lipidomics testing and transcriptomics sequencing. The purpose of the study was to determine the differences in intramuscular fat between the two breeds and identify the reasons for the differences. We found that the intramuscular fat content of Luchuan pigs was significantly higher than that of Duroc pigs. The triglycerides and diglycerides related to flavor were higher in Luchuan pigs compared to Duroc pigs. This phenotype may be caused by the difference in the expression of key genes in the glycerolipid metabolism signaling pathway.
Keywords: Duroc; Luchuan; intramuscular fat; lipomics; pork.
Copyright © 2021 Zhang, Liao, Sun, Pan, Liu, Miao, Li, Zhou and Xu.
Conflict of interest statement
The authors declare that the research was conducted in the absence of any commercial or financial relationships that could be construed as a potential conflict of interest.
Figures
Similar articles
-
Integrative metabolomic and transcriptomic analysis reveals difference in glucose and lipid metabolism in the longissimus muscle of Luchuan and Duroc pigs.Front Genet. 2023 Apr 6;14:1128033. doi: 10.3389/fgene.2023.1128033. eCollection 2023. Front Genet. 2023. PMID: 37091786 Free PMC article.
-
Transcriptome Analysis of the Adipose Tissue of Luchuan and Duroc Pigs.Animals (Basel). 2022 Aug 31;12(17):2258. doi: 10.3390/ani12172258. Animals (Basel). 2022. PMID: 36077979 Free PMC article.
-
Identification of Differentially Expressed Genes in the Longissimus Dorsi Muscle of Luchuan and Duroc Pigs by Transcriptome Sequencing.Genes (Basel). 2023 Jan 3;14(1):132. doi: 10.3390/genes14010132. Genes (Basel). 2023. PMID: 36672873 Free PMC article.
-
Comparative analysis of translatomics and transcriptomics in the longissimus dorsi muscle of Luchuan and Duroc pigs.PLoS One. 2025 Mar 18;20(3):e0319399. doi: 10.1371/journal.pone.0319399. eCollection 2025. PLoS One. 2025. PMID: 40100799 Free PMC article.
-
Transcriptomic Profiling of Meat Quality Traits of Skeletal Muscles of the Chinese Indigenous Huai Pig and Duroc Pig.Genes (Basel). 2023 Jul 28;14(8):1548. doi: 10.3390/genes14081548. Genes (Basel). 2023. PMID: 37628600 Free PMC article.
Cited by
-
Lipidomics and Transcriptome Reveal the Effects of Feeding Systems on Fatty Acids in Yak's Meat.Foods. 2022 Aug 26;11(17):2582. doi: 10.3390/foods11172582. Foods. 2022. PMID: 36076769 Free PMC article.
-
Integrated Multi-Omics of the Longissimus Dorsal Muscle Transcriptomics and Metabolomics Reveals Intramuscular Fat Accumulation Mechanism with Diet Energy Differences in Yaks.Biomolecules. 2025 Jul 16;15(7):1025. doi: 10.3390/biom15071025. Biomolecules. 2025. PMID: 40723897 Free PMC article.
-
Metabolome-Based Genome-Wide Association Study of Duck Meat Leads to Novel Genetic and Biochemical Insights.Adv Sci (Weinh). 2023 Jun;10(18):e2300148. doi: 10.1002/advs.202300148. Epub 2023 Apr 4. Adv Sci (Weinh). 2023. PMID: 37013465 Free PMC article.
-
Integrative metabolomic and transcriptomic analysis reveals difference in glucose and lipid metabolism in the longissimus muscle of Luchuan and Duroc pigs.Front Genet. 2023 Apr 6;14:1128033. doi: 10.3389/fgene.2023.1128033. eCollection 2023. Front Genet. 2023. PMID: 37091786 Free PMC article.
-
Integrated Multi-Tissue Lipidomics and Transcriptomics Reveal Differences in Lipid Composition Between Mashen and Duroc × (Landrace × Yorkshire) Pigs.Animals (Basel). 2025 Apr 30;15(9):1280. doi: 10.3390/ani15091280. Animals (Basel). 2025. PMID: 40362094 Free PMC article.
References
LinkOut - more resources
Full Text Sources
Other Literature Sources