. 2021 May 14:8:635548.
doi: 10.3389/fmolb.2021.635548. eCollection 2021.

A Combined Acceptor Photobleaching and Donor Fluorescence Lifetime Imaging Microscopy Approach to Analyze Multi-Protein Interactions in Living Cells

Affiliations

A Combined Acceptor Photobleaching and Donor Fluorescence Lifetime Imaging Microscopy Approach to Analyze Multi-Protein Interactions in Living Cells

Robert Eckenstaler et al. Front Mol Biosci. .

Abstract

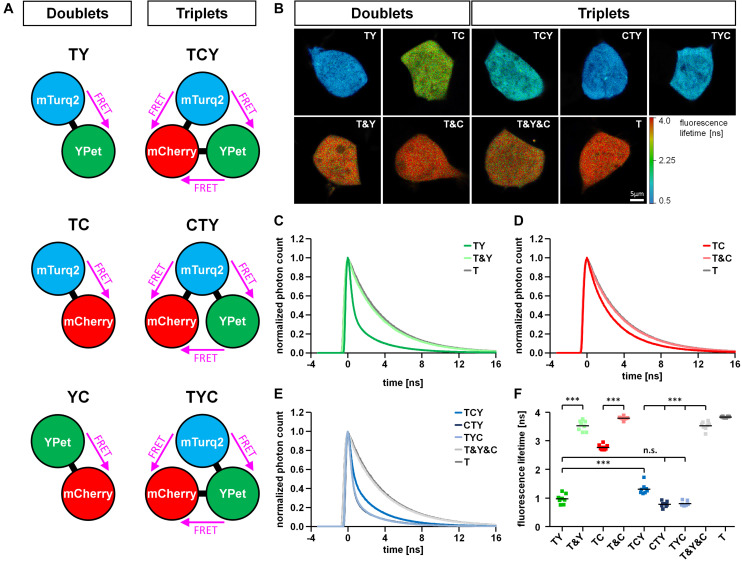
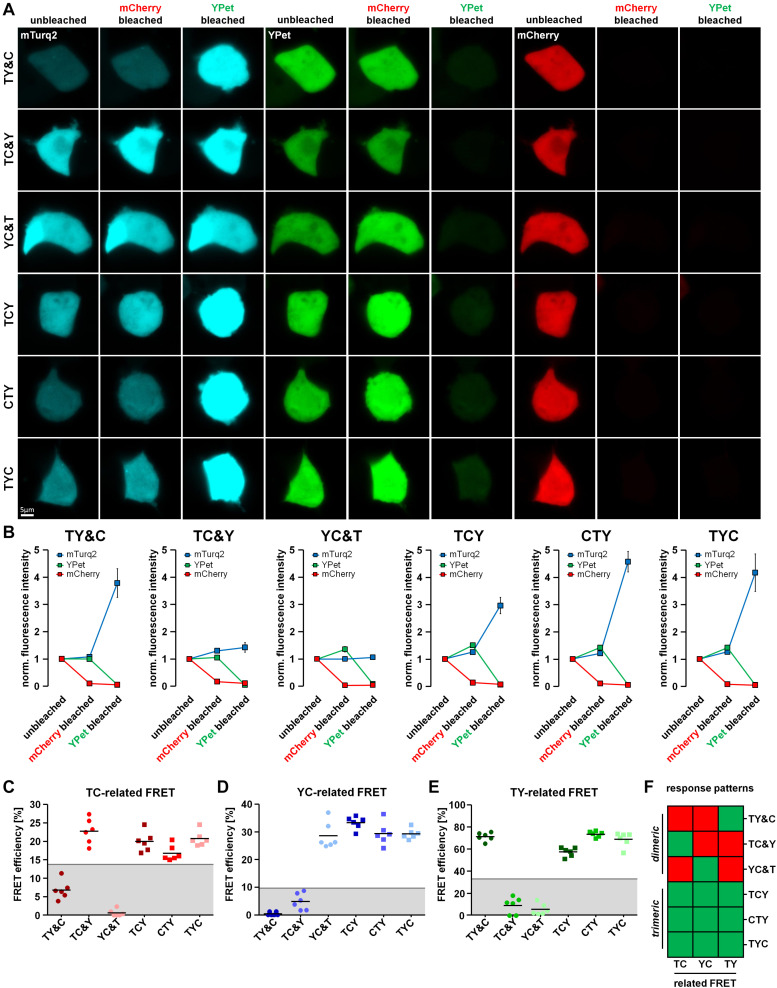
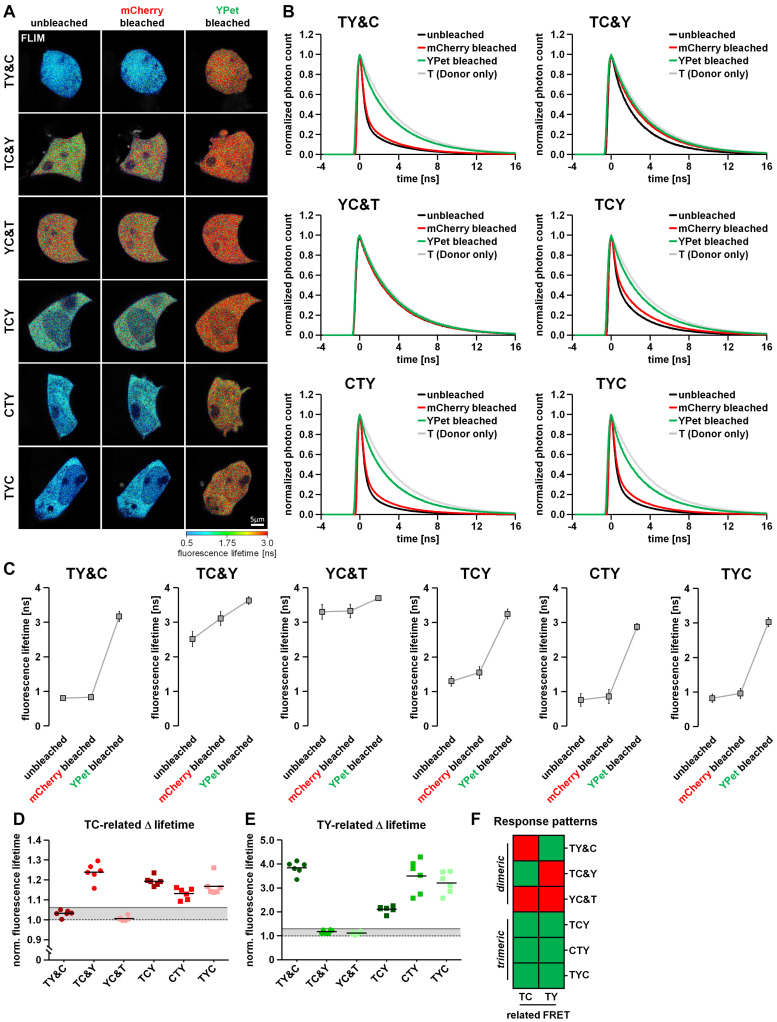
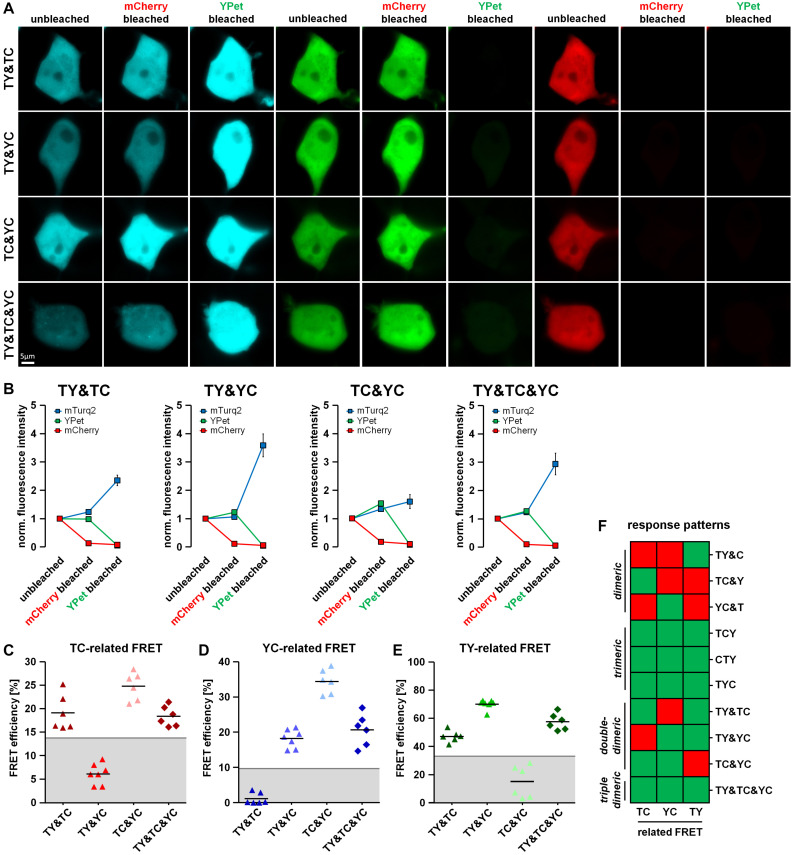
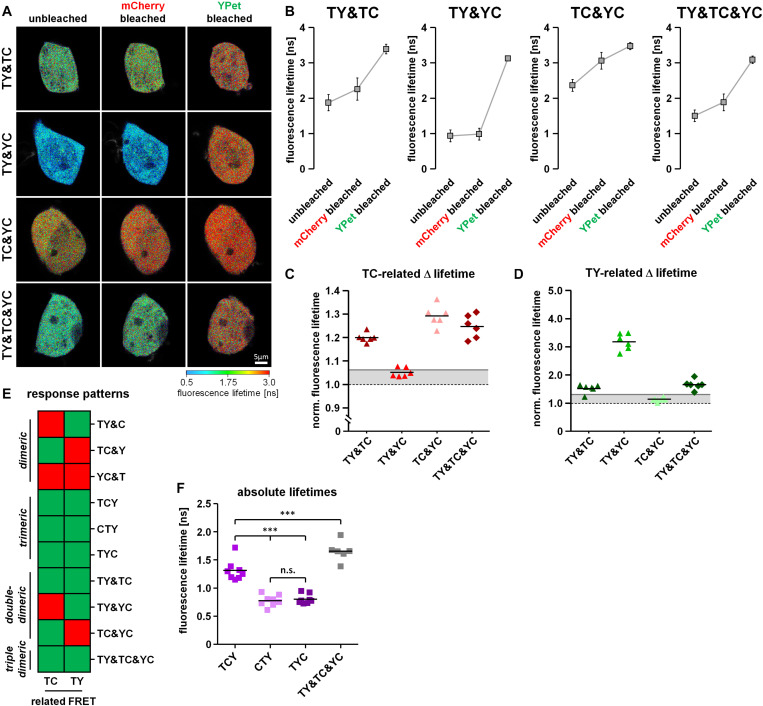
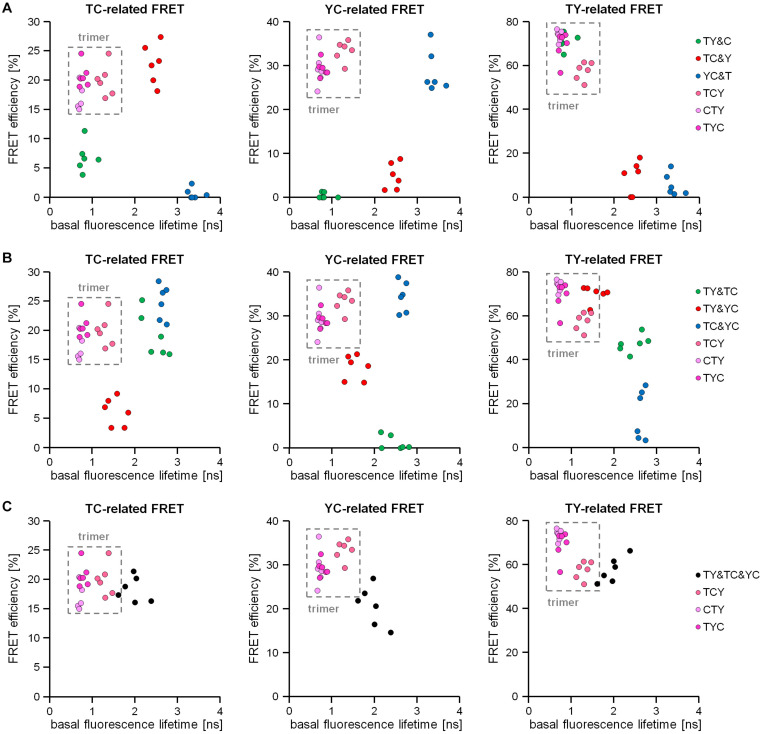
Protein-protein interaction studies often provide new insights, i.e., into the formation of protein complexes relevant for structural oligomerization, regulation of enzymatic activity or information transfer within signal transduction pathways. Mostly, biochemical approaches have been used to study such interactions, but their results are limited to observations from lysed cells. A powerful tool for the non-invasive investigation of protein-protein interactions in the context of living cells is the microscopic analysis of Förster Resonance Energy Transfer (FRET) among fluorescent proteins. Normally, FRET is used to monitor the interaction state of two proteins, but in addition, FRET studies have been used to investigate three or more interacting proteins at the same time. Here we describe a fluorescence microscopy-based method which applies a novel 2-step acceptor photobleaching protocol to discriminate between non-interacting, dimeric interacting and trimeric interacting states within a three-fluorophore setup. For this purpose, intensity- and fluorescence lifetime-related FRET effects were analyzed on representative fluorescent dimeric and trimeric FRET-constructs expressed in the cytosol of HEK293 cells. In particular, by combining FLIM- and intensity-based FRET data acquisition and interpretation, our method allows to distinguish trimeric from different types of dimeric (single-, double- or triple-dimeric) protein-protein interactions of three potential interaction partners in the physiological setting of living cells.

Keywords: 3-way FRET; FLIM; acceptor photobleaching; multiple protein–protein interactions; three-fluorophore FRET.


Conflict of interest statement

The authors declare that the research was conducted in the absence of any commercial or financial relationships that could be construed as a potential conflict of interest.

Figures

FIGURE 1
FIGURE 1
Basal properties of FRET triplet and doublet constructs. (A) Schematic drawing of FRET doublet and FRET triplet constructs composed of a combination of the fluorophores mTurquoise2 (T), YPet (Y) and mCherry (C). Note that within the triplet constructs, FRET can occur in three different directions. (B) Representative fluorescence lifetime images of FRET doublet (TY, TC) and FRET triplet constructs (TCY, CTY, TYC) expressed in HEK293T cells in comparison to the respective negative controls (T&Y, T&C, T&Y&C) and the FRET donor alone (T). (C–E) Average decay profiles of mTurquoise2 for different conditions (n = 8). The decay profile of the TY doublet shows a clear FRET-induced left shift compared to the negative control (T&Y) and the donor alone (T) (C). The left shift observed in the TC doublet was less prominent (D). FRET-induced left shifts of the fluorescence decay observed in the FRET triplets was different depending on the position of T, Y and C within the linear construct (E). (F) Average amplitude weighted lifetimes of all FRET constructs, their respective negative controls and the FRET donor mTurquoise2 alone (n = 8). Note the differences in lifetime reduction according to the type of interacting fluorophores in the FRET doublets (TY, TC) or the positioning of the fluorophores within the FRET triplet constructs (TCY, CTY, TYC).
FIGURE 2
FIGURE 2
Differentiation of dimeric and trimeric interactions using fluorescence intensity-based measurements. (A) HEK293T cells transfected with either the FRET triplet constructs (TCY, CTY, TYC) or the FRET doublets with their respective missing fluorophore (TY&C, TC&Y, YC&T). Representative images show the fluorescence intensity of mTurquoise2, YPet and mCherry before bleaching (unbleached), after the first bleaching step (mCherry bleached) and after the second bleaching step (YPet bleached). (B) Average fluorescence intensity of mTurquoise2 (mTurq2; blue), YPet (green) and mCherry (red) normalized to the first image acquired (n = 6). After mCherry bleaching, the YPet fluorescence intensity increased in YC&T, TCY, CTY and TYC and the mTurquoise2 fluorescence intensity increased in TC&Y, TCY, CTY and TYC, only. There was no increase in YPet fluorescence intensity in TY&C and TC&Y samples and no increase in mTurquoise2 fluorescence intensity in TY&C and YC&T samples due to the absence of specific YC- and TC-FRET. After YPet bleaching, the mTurquoise2 fluorescence intensity drastically increased in TY&C, TCY, CTY and TYC, whereas the mTurquoise2 fluorescence intensity remained rather constant in TC&Y and YC&T samples due to the absence of specific TY-FRET. The fluorescence increase corresponded to the unquenching of the FRET donor fluorescence intensity after bleaching its respective FRET acceptor, thereby abolishing FRET between them. (C–E) FRET efficiencies calculated from the change in fluorescence intensity of mTurquoise2 [TC-related FRET, (C)] and YPet [YC-related FRET, (D)] after mCherry bleaching and the FRET efficiency obtained from the change of mTurquoise2 fluorescence after YPet bleaching [TY-related FRET, (E)] (n = 6). Threshold values set to discriminate interaction-specific FRET from non-specific FRET are indicated by gray lines. Note the different response patterns of FRET doublets compared to those from FRET triplets. (F) Color coded response pattern of fluorescence intensity-based measurements. A Yes-response (occurrence of specific FRET) is indicated by a green and a No-response (no or non-specific FRET) is indicated by a red square. According to these patterns, dimeric interactions (FRET doublets) can be clearly discriminated from trimeric interactions (FRET triplets).
FIGURE 3
FIGURE 3
Differentiation of dimeric and trimeric interactions using fluorescence lifetime-based measurements. (A) HEK293T cells transfected with either the FRET triplet constructs (TCY, CTY, TYC) or the FRET doublets with their respective missing fluorophore (TY&C, TC&Y, YC&T). Representative images show the color-coded fluorescence lifetime of mTurquoise2 before bleaching (unbleached), after the first bleaching step (mCherry bleached) and after the second bleaching step (YPet bleached). (B) Average profiles of mTurquoise2 fluorescence decay (n = 6). Note the sequential reversion of the FRET-induced left shift of mTurquoise2 fluorescence decay after the first and the second bleaching step. (C) Change in average amplitude weighted lifetime of the cells during the two-step bleaching protocol (n = 6). After mCherry bleaching, the fluorescence lifetime increased moderately in TC&Y and slightly in TCY, CTY and TYC samples, whereas it remained rather constant in TY&C and YC&T samples. In contrast, after YPet bleaching, the fluorescence lifetime increased drastically in TY&C, TCY, CTY and TYC, whereas in TC&Y and YC&T samples only a moderate increase was observed. Note the different basal fluorescence lifetime depending on the combination and composition of the FRET constructs. (D,E) Relative change in fluorescence lifetime of mTurquoise2 after mCherry bleaching [TC-related Δlifetime, (D)] and the additional relative change in fluorescence lifetime after YPet bleaching [TY-related Δlifetime, (E)] (n = 6). Gray lines indicate threshold values to discriminate FRET-specific from non-specific lifetime changes of the donor. (F) Color coded response pattern of fluorescence lifetime-based measurements. For each matrix, a Yes-response (occurrence of specific FRET) is indicated by a green and a No-response (no or non-specific FRET) is indicated by a red square. According to these patterns, dimeric interactions (FRET doublets) can be clearly discriminated from trimeric interactions (FRET triplets).
FIGURE 4
FIGURE 4
Discrimination of different types of dimeric interactions among three potential interaction partners using fluorescence intensity-based measurements. (A) HEK293T cells were co-transfected with two doublet constructs (TY&TC, TY&YC, TC&YC) or a combination of all three FRET doublets (TY&TC&YC). Representative images showing the fluorescence intensity of mTurquoise2, YPet and mCherry before bleaching (unbleached), after the first bleaching step (mCherry bleached) and after the second bleaching step (YPet bleached). (B) Average fluorescence intensity of mTurquoise2 (blue), YPet (green), and mCherry (red) normalized to the first image acquired (n = 6). After mCherry bleaching, the YPet fluorescence intensity increased in TY&YC, TC&YC and TY&TC&YC samples, while it slightly decreased in TY&TC. In contrast, the intensity of mTurquoise2 increased in TY&TC, TC&YC and TY&TC&YC but remained rather constant in TY&YC samples. After YPet bleaching, the mTurquoise2 fluorescence intensity drastically increased in TY&TC, TY&YC and TY&TC&YC, only. (C–E) FRET efficiencies calculated from the change in fluorescence intensity of mTurquoise2 (C) and YPet (D) after mCherry bleaching (first bleaching step) and the from the additional relative change of mTurquoise2 fluorescence after YPet bleaching [(E), second bleaching step] for double transfections TY&TC, TY&YC and TC&YC as well as the triple transfection TY&TC&YC (n = 6). Threshold values to discriminate interaction-specific FRET from non-specific FRET are indicated by gray lines. (F) Updated color-coded response patterns and decision matrix of fluorescence intensity-based measurements. For each direction of FRET, a Yes-response (occurrence of specific FRET) is indicated by a green and a No-response (no or non-specific FRET) is indicated by a red square. The patterns can be used to discriminate dimeric from trimeric and double-dimeric interactions. However, the response patterns are not suitable to distinguish between trimeric interactions and triple-dimeric interactions in our experimental approach.
FIGURE 5
FIGURE 5
Discrimination of different types of dimeric interactions among three potential interaction partners using fluorescence lifetime-based measurements. (A) Representative images showing the color-coded fluorescence lifetime of mTurquoise2 before bleaching (unbleached), after the first bleaching step (mCherry bleached) and after the second bleaching step (YPet bleached). (B) Change in average amplitude weighted lifetime of the cells during the two-step bleaching protocol (n = 6). After mCherry bleaching, the fluorescence lifetime increased in TY&TC, TC&YC and TY&TC&YC samples, but remained constant in TY&YC. After YPet bleaching, the fluorescence lifetime strongly increased in TY&TC, TY&YC and TY&TC&YC, but only moderately in TC&YC. (C,D) Relative change in fluorescence lifetime of mTurquoise2 after mCherry bleaching [(C), first bleaching step] and the additional relative change in fluorescence lifetime after YPet bleaching [(D), second bleaching step] (n = 6). Gray lines indicate threshold values to discriminate FRET-specific from non-specific lifetime changes of the donor. (E) Updated color-coded response patterns and decision matrix of fluorescence lifetime-based measurements. For each direction of FRET, a Yes-response (occurrence of specific FRET) is indicated by a green and a No-response (no or non-specific FRET) is indicated by a red square. Without information about YC-related FRET, these patterns cannot be used to discriminate dimeric from trimeric and double-dimeric interactions as it was shown for the intensity-based patterns. (F) However, the different basal fluorescence lifetimes of the combination of all three dimers versus each of the FRET triplet constructs allow for their discrimination of multi-dimeric and trimeric interactions which was not possible from the intensity-based pattern.
FIGURE 6
FIGURE 6
Discrimination of trimeric from dimeric interactions by using a combination of acceptor photobleaching and the basal donor fluorescence lifetime assessment. Correlation of the basal fluorescence lifetime of mTurquoise2 with the intensity-based TC-FRET, YC-FRET and TY-FRET-related FRET efficiencies obtained from the acceptor photobleaching of the same cell (n = 6 each). (A) Discrimination of trimeric interactions (FRET triplets TCY, CTY, TYC) from dimeric interactions (FRET doublets TY&C, TC&Y, YC&T) in this correlation. In all three FRET types (T > Y; T > C; Y > C) investigated, the trimeric interaction-related data points occupy the upper left quadrant of the correlation plots (marked as a gray rectangles), while the data points of the dimeric interactions are predominantly located in other quadrants. (B) Discrimination of the trimeric interactions (FRET triplets TCY, CTY, TYC) from double-dimeric interactions (double FRET doublets TY&TC, TY&YC, TC&YC) using the same correlation plot system. Again, data points derived from double-dimeric interactions are mostly located outside the upper left quadrant. (C) Correlation plots deduced from trimeric interactions (FRET triplets TCY, CTY, TYC) and triple-dimeric interactions (TY&TC&YC). Note that due to dilution effects on mTurquoise2 lifetime in the basal unbleached state as well as distinguishable responses after acceptor photobleaching, data distribution in TY&TC&YC samples clearly differs from data distribution in TCY, CTY or TYC samples, respectively.

Similar articles

Cited by

References

    1. Aneja A., Mathur N., Bhatnagar P. K., Mathur P. C. (2008). Triple-FRET technique for energy transfer between conjugated polymer and TAMRA dye with possible applications in medical diagnostics. J. Biol. Phys. 34 487–493. 10.1007/s10867-008-9107-y - DOI - PMC - PubMed
    1. Bajar B. T., Wang E. S., Zhang S., Lin M. Z., Chu J. (2016). A guide to fluorescent protein FRET pairs. Sensors (Basel) 16:1488. 10.3390/s16091488 - DOI - PMC - PubMed
    1. Chakraborty H., Chattopadhyay A. (2015). Excitements and challenges in GPCR oligomerization: molecular insight from FRET. ACS Chem. Neurosci. 6 199–206. 10.1021/cn500231d - DOI - PubMed
    1. Chung H. S., Meng F., Kim J. Y., McHale K., Gopich I. V., Louis J. M. (2017). Oligomerization of the tetramerization domain of p53 probed by two- and three-color single-molecule FRET. Proc. Natl. Acad. Sci. U.S.A. 114 E6812–E6821. 10.1073/pnas.1700357114 - DOI - PMC - PubMed
    1. Clegg R. M. (1995). Fluorescence resonance energy transfer. Curr. Opin. Biotechnol. 6 103–110. 10.1016/0958-1669(95)80016-6 - DOI - PubMed

LinkOut - more resources