

Gaining Insights Into Metabolic Networks Using Chemometrics and Bioinformatics: Chronic Kidney Disease as a Clinical Model
- PMID: 34055893
- PMCID: PMC8163225
- DOI: 10.3389/fmolb.2021.682559
Gaining Insights Into Metabolic Networks Using Chemometrics and Bioinformatics: Chronic Kidney Disease as a Clinical Model
Abstract
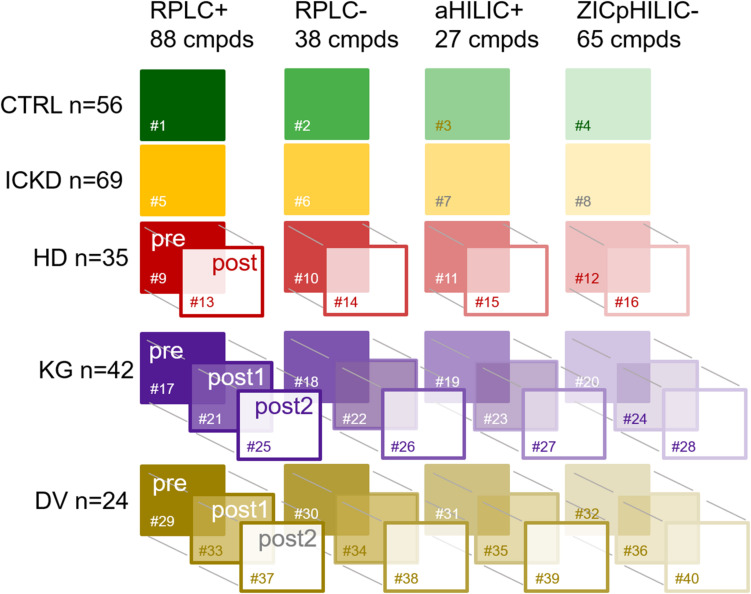
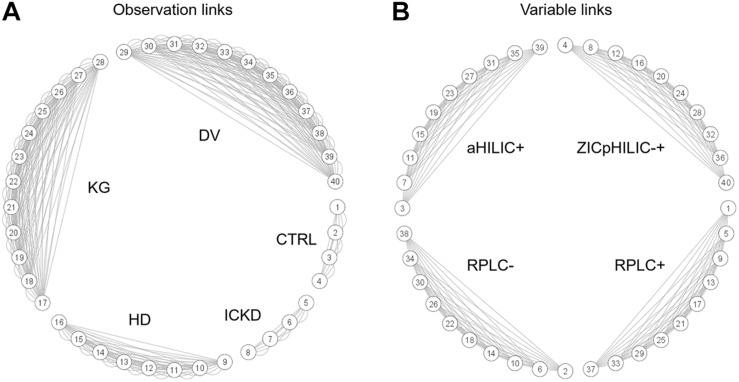
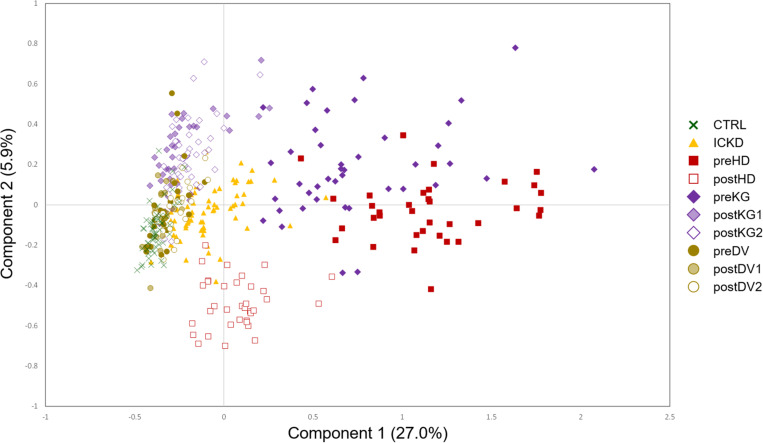
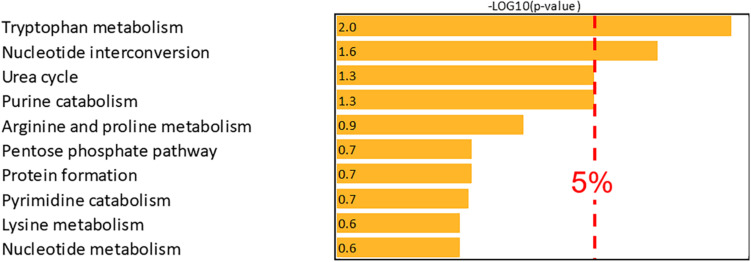
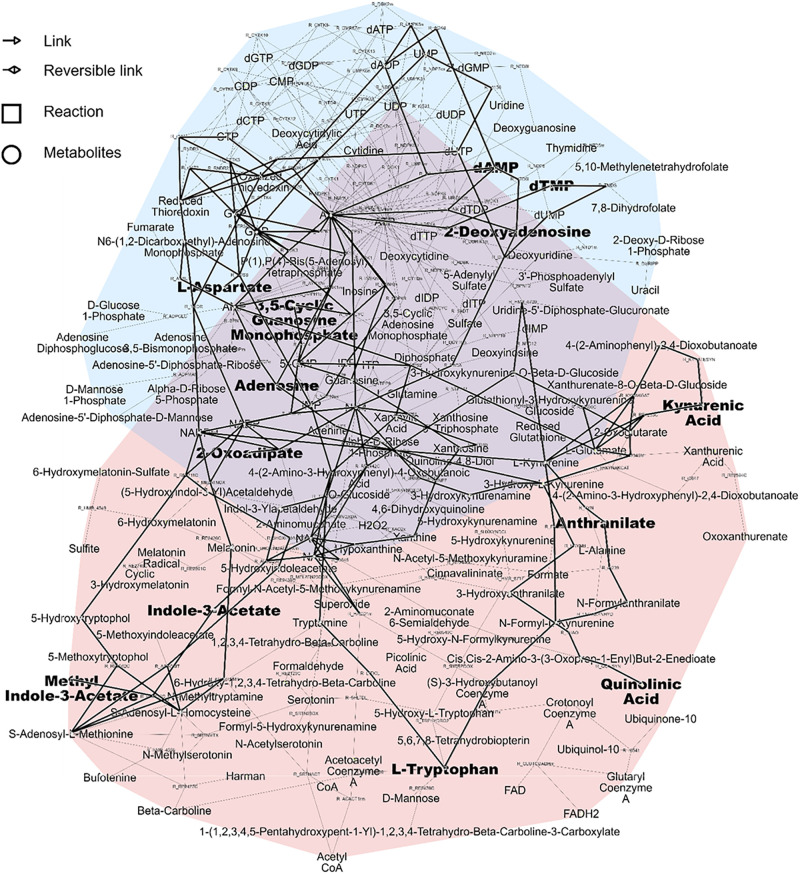
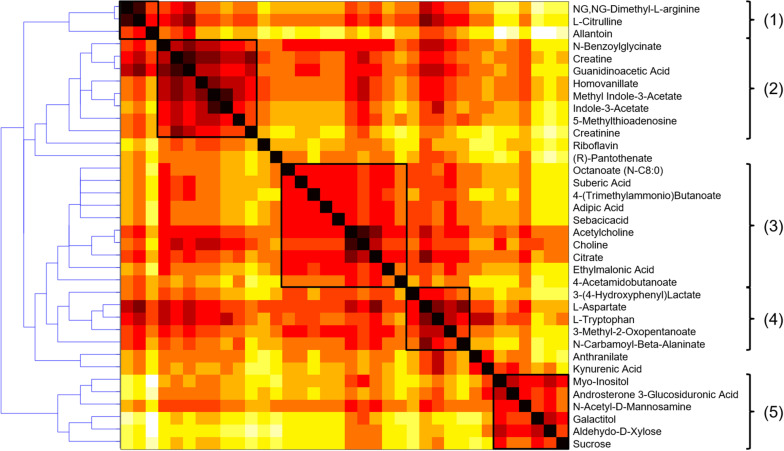
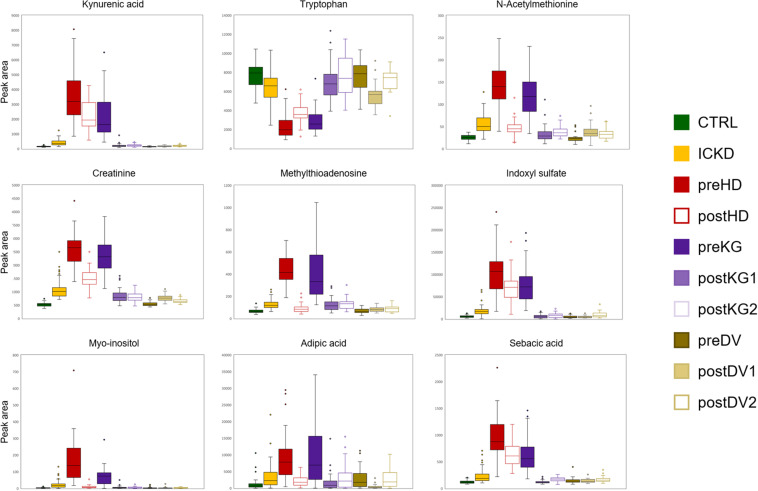
Because of its ability to generate biological hypotheses, metabolomics offers an innovative and promising approach in many fields, including clinical research. However, collecting specimens in this setting can be difficult to standardize, especially when groups of patients with different degrees of disease severity are considered. In addition, despite major technological advances, it remains challenging to measure all the compounds defining the metabolic network of a biological system. In this context, the characterization of samples based on several analytical setups is now recognized as an efficient strategy to improve the coverage of metabolic complexity. For this purpose, chemometrics proposes efficient methods to reduce the dimensionality of these complex datasets spread over several matrices, allowing the integration of different sources or structures of metabolic information. Bioinformatics databases and query tools designed to describe and explore metabolic network models offer extremely useful solutions for the contextualization of potential biomarker subsets, enabling mechanistic hypotheses to be considered rather than simple associations. In this study, network principal component analysis was used to investigate samples collected from three cohorts of patients including multiple stages of chronic kidney disease. Metabolic profiles were measured using a combination of four analytical setups involving different separation modes in liquid chromatography coupled to high resolution mass spectrometry. Based on the chemometric model, specific patterns of metabolites, such as N-acetyl amino acids, could be associated with the different subgroups of patients. Further investigation of the metabolic signatures carried out using genome-scale network modeling confirmed both tryptophan metabolism and nucleotide interconversion as relevant pathways potentially associated with disease severity. Metabolic modules composed of chemically adjacent or close compounds of biological relevance were further investigated using carbon transfer reaction paths. Overall, the proposed integrative data analysis strategy allowed deeper insights into the metabolic routes associated with different groups of patients to be gained. Because of their complementary role in the knowledge discovery process, the association of chemometrics and bioinformatics in a common workflow is therefore shown as an efficient methodology to gain meaningful insights in a clinical context.
Keywords: bioinformatics; chemometrics; chronic kidney disease; integrative data analysis; metabolic networks; metabolomics.
Copyright © 2021 Boccard, Schvartz, Codesido, Hanafi, Gagnebin, Ponte, Jourdan and Rudaz.
Conflict of interest statement
The authors declare that this study received indirect partial funding from AstraZeneca. The funder was not involved in the study design, collection, analysis, interpretation of data, the writing of this article or the decision to submit it for publication.
Figures
References
-
- Boccard J., Rudaz S. (2014). Harnessing the complexity of metabolomic data with chemometrics. J. Chemometrics 28 1–9. 10.1002/cem.2567 - DOI
-
- Boelaert J., t’Kindt R., Schepers E., Jorge L., Glorieux G., Neirynck N., et al. (2013). State-of-the-art non-targeted metabolomics in the study of chronic kidney disease. Metabolomics 10 425–442. 10.1007/s11306-013-0592-z - DOI
-
- Broadhurst D., Goodacre R., Reinke S. N., Kuligowski J., I, Wilson D., Lewis M. R., et al. (2018). Guidelines and considerations for the use of system suitability and quality control samples in mass spectrometry assays applied in untargeted clinical metabolomic studies. Metabolomics 14:72. - PMC - PubMed
LinkOut - more resources
Full Text Sources
Other Literature Sources