. 2021 May 25;7(3):e597.
doi: 10.1212/NXG.0000000000000597. eCollection 2021 Jun.

Diagnosing Mitochondrial Disorders Remains Challenging in the Omics Era

Affiliations

Diagnosing Mitochondrial Disorders Remains Challenging in the Omics Era

Patrick Forny et al. Neurol Genet. .

Abstract

Objective: We hypothesized that novel investigative pathways are needed to decrease diagnostic odysseys in pediatric mitochondrial disease and sought to determine the utility of clinical exome sequencing in a large cohort with suspected mitochondrial disease and to explore whether any of the traditional indicators of mitochondrial disease predict a confirmed genetic diagnosis.

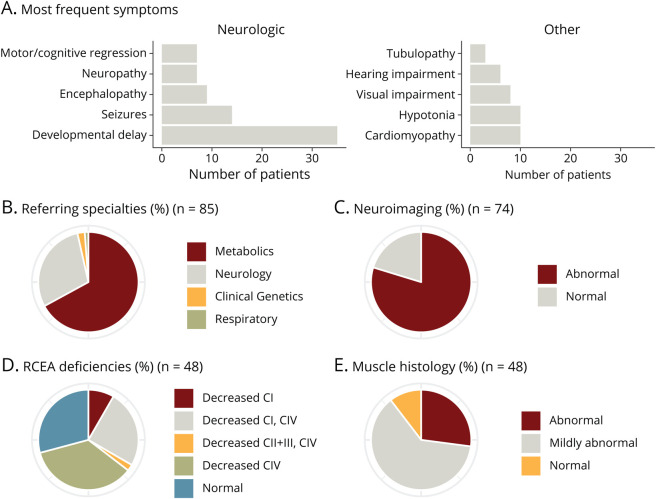
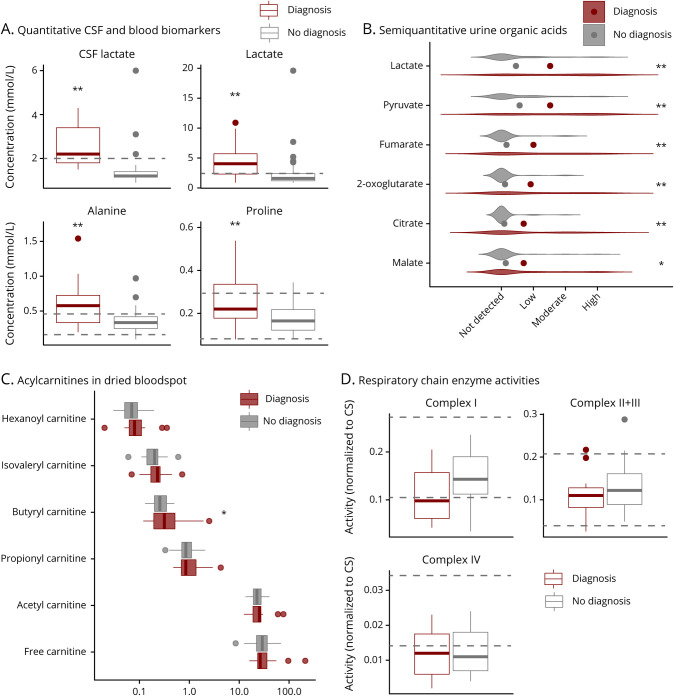
Methods: We investigated a cohort of 85 pediatric patients using clinical exome sequencing and compared the results with the outcome of traditional diagnostic tests, including biochemical testing of routine parameters (lactate, alanine, and proline), neuroimaging, and muscle biopsy with histology and respiratory chain enzyme activity studies.

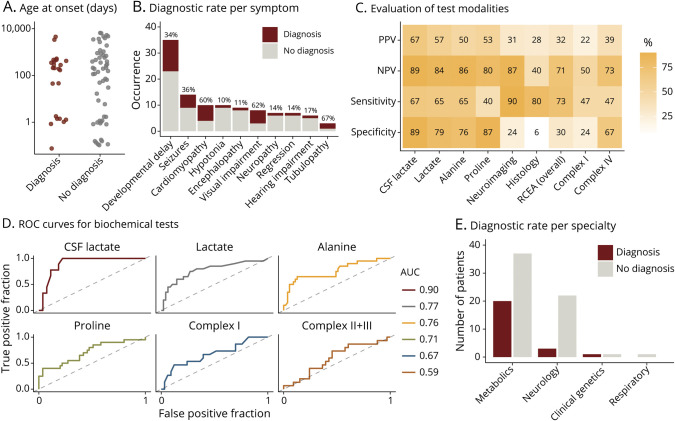
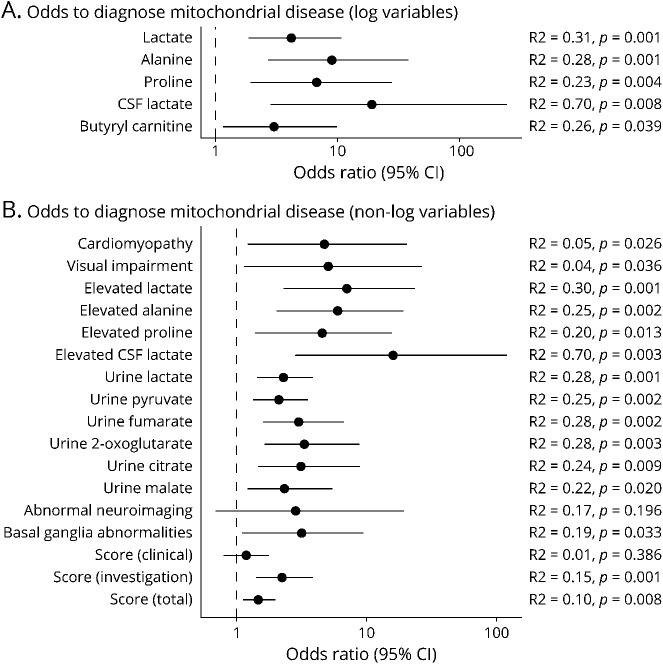
Results: We established a genetic diagnosis in 36.5% of the cohort and report 20 novel disease-causing variants (1 mitochondrial DNA). Counterintuitively, routine biochemical markers were more predictive of mitochondrial disease than more invasive and elaborate muscle studies.

Conclusions: We propose using biochemical markers to support the clinical suspicion of mitochondrial disease and then apply first-line clinical exome sequencing to identify a definite diagnosis. Muscle biopsy studies should only be used in clinically urgent situations or to confirm an inconclusive genetic result.

Classification of evidence: This is a Class II diagnostic accuracy study showing that the combination of CSF and plasma biochemical tests plus neuroimaging could predict the presence or absence of exome sequencing confirmed mitochondrial disorders.


Figures

Figure 1
Figure 1. Patient Cohort Characterization
(A) Bar chart depicting number of patients in whom a specific symptom was found. (B) Referral of patients for clinical exome sequencing per medical specialty. (C) Pie chart depicting proportions of general neuroimaging outcomes. (D) Summary of the outcome of respiratory chain enzyme activity (RCEA) measurements in muscle biopsy. (E) General muscle (light and electron) histology results. For all pie charts, n values indicate in how many patients the investigation was performed.
Figure 2
Figure 2. Biochemical Characterization
(A) Boxplots of CSF and plasma biomarkers. Dashed horizontal lines indicate reference ranges; for CSF lactate and plasma lactate, normal values are below the dashed horizontal line. (B) Violin plots illustrating results of semiquantitative urine organic acid measurements, points represent mean values. (C) Horizontal boxplots of acylcarnitine results. Boxplots consist of horizontal marks for the 25th percentile, the median, and the 75th percentile, whiskers extend to the 5th and 95th percentile, and outliers are represented as separate individual values. (D) Boxplot of levels of respiratory chain enzyme activities normalized to citrate synthase (CS) activity. Dashed horizontal lines indicate reference ranges. All plots are split in 2 groups of patients with a mitochondrial diagnosis in red and those with no mitochondrial diagnosis in gray. Significance of differences was determined by logistic regression analysis. * = p ≤ 0.05; ** = p ≤ 0.01.
Figure 3
Figure 3. Predictive Parameters for Mitochondrial Disease
The panels in this figure describe comparisons between patients with a mitochondrial diagnosis (red) and patients with no diagnosis (including nonmitochondrial diagnosis, gray). (A) Age at presentation of individual patients; for better visibility on the log scale (y-axis), patients with antenatal abnormalities were assigned an age at onset of 0.1 day and for onset at birth of 1 day. (B) Bar chart illustrating the occurrence of the most frequent symptoms in the cohort, including diagnostic rate in percent for each individual symptom above the bars, as calculated by number of patients with this symptom and a mitochondrial diagnosis divided by the number of all patients with this symptom. (C) Heatmap depicting levels of positive predictive value (PPV), negative predicate value (NPV), sensitivity, and specificity for different test modalities, calculated using a genetic mitochondrial diagnosis as the gold standard. In the calculations, a positive outcome of test modalities was considered as follows: raised levels of lactate, alanine, and proline, decreased activity of RCEA complexes, and abnormal neuroimaging, RCEA, or histology. (D) ROC curves for selected continuous test variables. (E) Bar graph depicting the outcome of clinical exome analysis per referring specialty. AUC = area under the ROC curve; RCEA = respiratory chain enzyme activity; ROC = receiver operating characteristic.
Figure 4
Figure 4. Odds Ratios of Predictive Parameters
Forest plot depicting effect sizes of diagnostic measures, including 95% confidence interval (CI), derived from logistic regression analysis. (A) These continuous variables were log transformed before analysis. (B) These variables are all discrete, e.g., presence or absence of cardiomyopathy and presence or absence of elevated lactate. R2 = R2 according to the McFadden method.

References

    1. Rahman J, Rahman S. Mitochondrial medicine in the omics era. Lancet. 2018;391:2560–2574. - PubMed
    1. Rahman S. Mitochondrial disease in children. J Intern Med. 2020;287:609–633. - PubMed
    1. Boenzi S, Diodato D. Biomarkers for mitochondrial energy metabolism diseases. Essays Biochem. 2018;62:443–454. - PubMed
    1. Parikh S, Karaa A, Goldstein A, et al. . Diagnosis of ‘possible’ mitochondrial disease: an existential crisis. J Med Genet. 2019;56:123–130. - PubMed
    1. Debray F-G, Mitchell GA, Allard P, Robinson BH, Hanley JA, Lambert M. Diagnostic accuracy of blood lactate-to-pyruvate molar ratio in the differential diagnosis of congenital lactic acidosis. Clin Chem. 2007;53:916–921. - PubMed