. 2021 Apr 7;6(15):10039-10046.
doi: 10.1021/acsomega.0c06281. eCollection 2021 Apr 20.

Simple Fluorogenic Cellular Assay for Histone Deacetylase Inhibitors Based on Split-Yellow Fluorescent Protein and Intrabodies

Affiliations

Simple Fluorogenic Cellular Assay for Histone Deacetylase Inhibitors Based on Split-Yellow Fluorescent Protein and Intrabodies

Yuki Ohmuro-Matsuyama et al. ACS Omega. .

Abstract

Histone deacetylase (HDAC) inhibitors that regulate the posttranslational modifications of histone tails are therapeutic drugs for many diseases such as cancers, neurodegenerative diseases, and asthma; however, convenient and sensitive methods to measure the effect of HDAC inhibitors in cultured mammalian cells remain limited. In this study, a fluorogenic assay was developed to detect the acetylation of lysine 9 on histone H3 (H3K9ac), which is involved in several cancers, Alzheimer's disease, and autism spectrum disorder. To monitor the changes in H3K9ac levels, an H3K9ac-specific intrabody fused with a small fragment FP11 of the split-yellow fluorescent protein (YFP) (scFv-FP11) was expressed in mammalian cells, together with a larger YFP fragment FP1-10 fused with a nuclear localization signal. When the intranuclear level of H3K9ac is increased, the scFv-FP11 is more enriched in the nucleus via passive diffusion through the nuclear pores from the cytoplasm, which increases the chance of forming a fluorescent complex with the nuclear YFP1-10. The results showed that the YFP fluorescence increased when the cells were treated with HDAC inhibitors. Moreover, the sensitivity of the split YFP reporter system to three HDAC inhibitors was higher than that of a conventional cell viability test. The assay system will be a simple and sensitive detection method to evaluate HDAC inhibitor activities at the levels of both single cells and cell populations.


Conflict of interest statement

The authors declare no competing financial interest.

Figures

Figure 1
Figure 1
Probe design strategy. (a) Scheme for the split sfYFP system. An sfYFP was separated into two fragments, FP1-10 (the region from the N-terminus to the 10th) and FP11 (the last 11th β-sheet strand). (b) Scheme for the fluorogenic detection of H3K9ac.
Figure 2
Figure 2
Observation of YFP signals in the nuclei induced by HDAC inhibitor treatments by confocal microscopy. Cos-7 (a) and U2OS (b) cells were transfected with CFP-scFv-FP11 without or with NLS-FP1-10, left for 5 h, and incubated with HDAC inhibitors for 22–25 h before image acquisition. sfYFP was reconstituted from the pairing of FP1-10 and CFP-scFv-FP11 in the nuclei when the cells were treated with HDAC inhibitors TSA, vorinostat, valproic acid, or 0.1% MeOH as a negative control. Scale bar: 5 μm.
Figure 3
Figure 3
Confocal microscopic analysis of Cos-7 cells expressing CFP-scFv-FP11 and NLS-FP1-10. Four hours after transfection, the cells were incubated with the vehicle (MeOH) or 1 μM TSA for 16 h, before fixation and staining with Cy5-labeled anti-H3K9ac antibody. (a) Single confocal sections for CFP, YFP, and Cy5 are shown. (b) Line intensity profiles are shown. Scale bar: 4 μm.
Figure 4
Figure 4
Fluorescence-activated cell sorter (FACS) analysis for detecting YFP signals in Cos-7 cells. Four hours after transfection, the cells were incubated with the vehicle (MeOH), 1 μM TSA, 10 μM vorinostat, or 10 mM valproic acid for 16 h, before harvesting for FACS. The YFP signals reconstituted from the pairing of FP1-10 and CFP-scFv-FP11 are compared. A total of 100 000 cells were analyzed per histogram. Yellow regions were selected as positive. The horizontal and vertical axes indicate the fluorescence intensity derived of YFP and the cell number, respectively. The thin yellow lines indicate the regions set for YFP-positive cell population.
Figure 5
Figure 5
Observation of YFP signals in the nuclei induced by HDAC inhibitor treatments. Four hours after Cos-7 cells were transfected with FP1-10 and APP-scFv-FP11, the cells were incubated with the vehicle (MeOH), 1 μM TSA, 10 μM vorinostat, or 10 mM valproic acid for 16 h, before live imaging. Reconstituted sfYFP signals from the pairing of FP1-10 and APP-scFv-FP11 in the nuclei were detected in the cells treated with HDAC inhibitors.
Figure 6
Figure 6
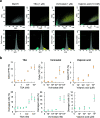
FACS analysis for fluorescent signals and abnormal cells. Four hours after Cos-7 cells were transfected with FP1-10 and APP-scFv-FP11, the cells were incubated with the vehicle (MeOH), 1 μM TSA, 10 μM vorinostat, or 10 mM valproic acid for 16 h, before harvesting for FACS. (a) Histograms of transfected Cos-7 cells with the pairing of FP1-10 and APP-scFv-FP11 when treated with HDAC inhibitors such as TSA, vorinostat, valproic acid, or 0.1% MeOH as a negative control. Upper panels, The horizontal and vertical axes indicate the front scatter (FSC) that reflects the cell size and the back scatter (BSC) that reflects the deformation of the cells, respectively. Lower panels, The horizontal and vertical axes indicate the fluorescence intensity derived of YFP and the cell number, respectively. The thresholds were set for both yellow (YFP-positive) and cyan (damaged) regions so that the lowest detectable concentrations of each HDAC inhibitor were obtained. The thin cyan, gray, and yellow thin lines indicate the regions for all, nondamaged, and YFP-positive cell populations, respectively. (b) The YFP-positive and damaged cell populations (%) calculated from the histograms. More than 4000 cells were analyzed. Data are shown as mean ± standard deviation (n = 3).

References

    1. Chen Z.; Li W.; Qiu F.; Huang Q.; Jiang Z.; Ye J.; Cheng P.; Low C.; Guo Y.; Yi X.; Chen W.; Yu Y.; Han Y.; Wu J.; Jin S.; Kong D.; Huang J. Aspirin cooperates with p300 to activate the acetylation of H3K9 and promote FasL-mediated apoptosis of cancer stem-like cells in colorectal cancer. Theranostics 2018, 8, 4447–4461. 10.7150/thno.24284. - DOI - PMC - PubMed
    1. Eckschlager T.; Plch J.; Stiborova M.; Hrabeta J. Histone deacetylase inhibitors as anticancer drugs. Int. J. Mol. Sci. 2017, 18, 1414.10.3390/ijms18071414. - DOI - PMC - PubMed
    1. Falkenberg K. J.; Johnstone R. W. Histone deacetylases and their inhibitors in cancer, neurological diseases and immune disorders. Nat. Rev. Drug Discovery 2014, 13, 673–691. 10.1038/nrd4360. - DOI - PubMed
    1. Gao X.; Lin S. H.; Ren F.; Li J. T.; Chen J. J.; Yao C. B.; Yang H. B.; Jiang S. X.; Yan G. Q.; Wang D.; Wang Y.; Liu Y.; Cai Z.; Xu Y. Y.; Chen J.; Yu W.; Yang P. Y.; Lei Q. Y. Acetate functions as an epigenetic metabolite to promote lipid synthesis under hypoxia. Nat. Commun. 2016, 7, 1196010.1038/ncomms11960. - DOI - PMC - PubMed
    1. Judes G.; Dagdemir A.; Karsli-Ceppioglu S.; Lebert A.; Echegut M.; Ngollo M.; Bignon Y. J.; Penault-Llorca F.; Bernard-Gallon D. H3K4 acetylation, H3K9 acetylation and H3K27 methylation in breast tumor molecular subtypes. Epigenomics 2016, 8, 909–924. 10.2217/epi-2016-0015. - DOI - PubMed

LinkOut - more resources