. 2021 Jun:36:100902.
doi: 10.1016/j.eclinm.2021.100902. Epub 2021 May 24.

A population-based analysis of the longevity of SARS-CoV-2 antibody seropositivity in the United States

Affiliations

A population-based analysis of the longevity of SARS-CoV-2 antibody seropositivity in the United States

David Alfego et al. EClinicalMedicine. 2021 Jun.

Abstract

Background: This cross-sectional study aimed to track population-based SARS-CoV-2 antibody seropositivity duration across the United States using observational data from a national clinical laboratory registry of patients tested by nucleic acid amplification (NAAT) and serologic assays. Knowledge of antibody seropositivity and its duration may help dictate post-pandemic planning.

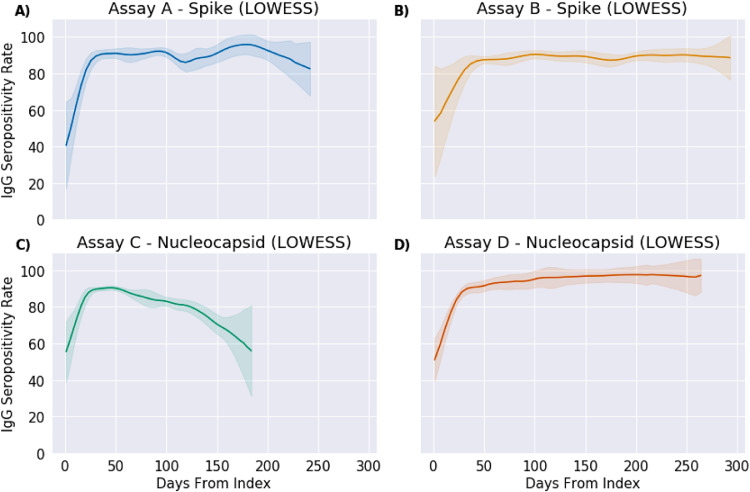
Methods: Using assays to detect antibodies to either nucleocapsid (N) or spike (S) proteins performed on specimens from 39,086 individuals with confirmed positive COVID-19 by reverse transcription-polymerase chain reaction (RT-PCR) from March 2020 to January 2021, we analyzed nationwide seropositivity rates of IgG up to 300 days following patients' initial positive NAAT test. Linear regression identified trends in seropositivity rates and logistic regression tested positive predictability by age, sex, assay type and days post-infection.

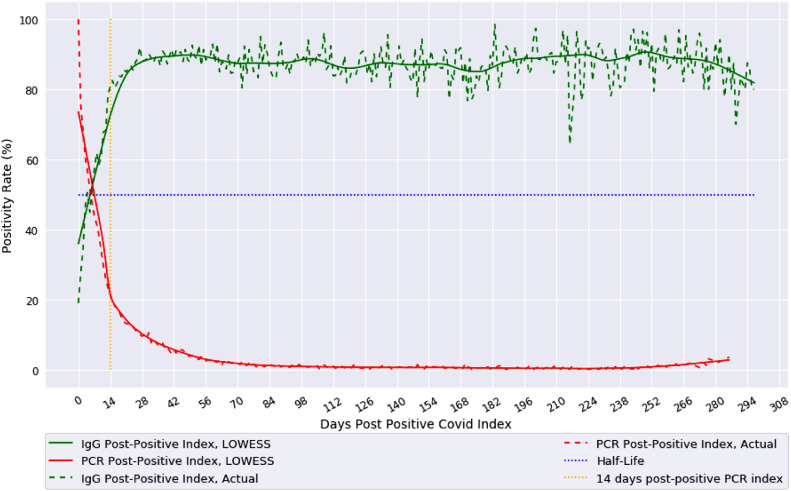
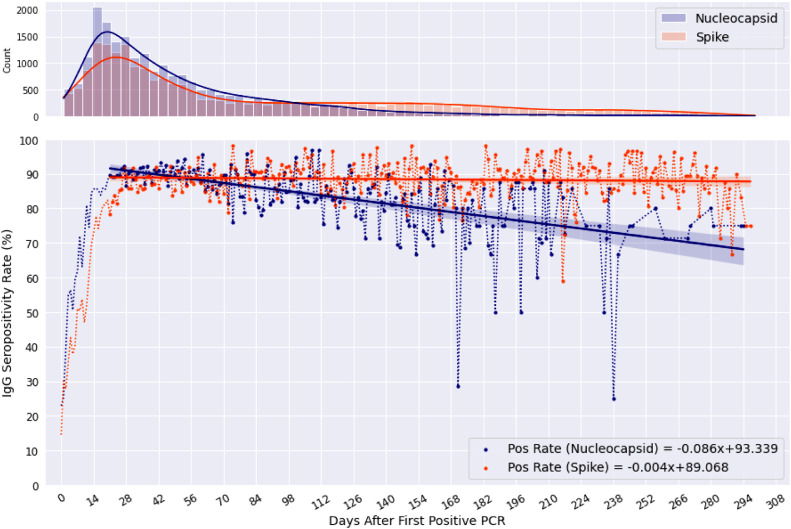
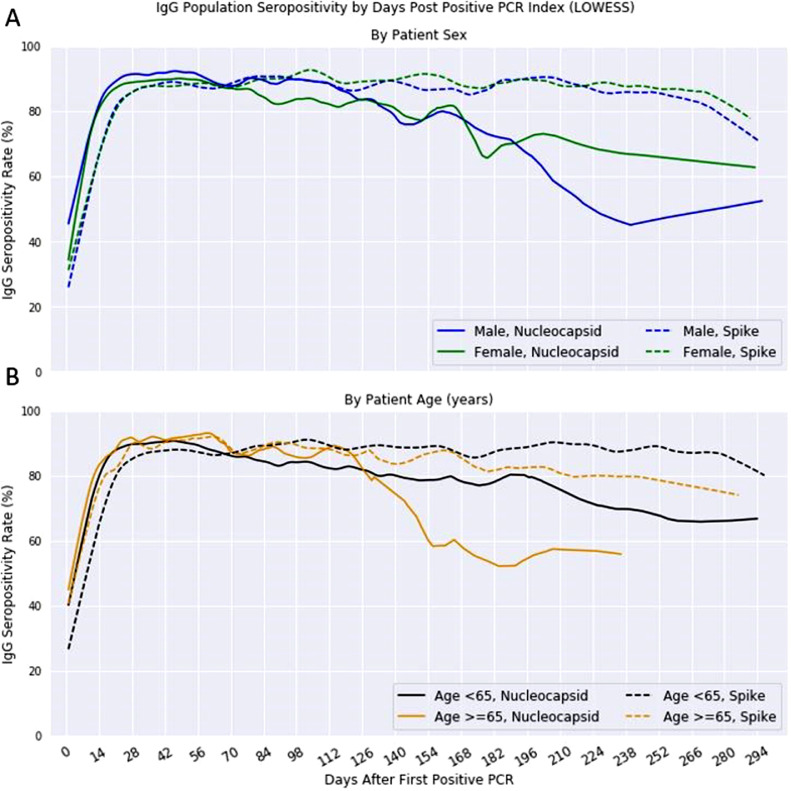
Findings: Seropositivity of IgG antibodies to both SARS-CoV-2 S and N-proteins followed a linear trend reaching approximately 90% positivity at 21 days post-index. The rate of N-protein seropositivity declined at a sharper rate, decaying to 68·2% [95% CI: 63·1-70·8%] after 293 days, while S-antibody seropositivity maintained a rate of 87·8% [95% CI: 86·3-89·1%] through 300 days. In addition to antigen type and the number of days post-positive PCR, age and gender were also significant factors in seropositivity prediction, with those under 65 years of age showing a more sustained seropositivity rate.

Interpretation: Observational data from a national clinical laboratory, though limited by an epidemiological view of the U.S. population, offer an encouraging timeline for the development and sustainability of antibodies up to ten months from natural infection and could inform post-pandemic planning.

Keywords: Antibody seropositivity; COVID-19; Real-world evidence; SARS-CoV-2.


Conflict of interest statement

None.

Figures

Fig. 1
Fig. 1
Population IgG and Follow-up PCR Positivity Rates using LOWESS moving regression. Actual population-based IgG seropositivity (green) of both nucleocapsid (N) and spike (S) proteins together, and follow-up PCR positivity rate (red) over days from initial positive PCR test for COVID-19 are shown from index of day 0 to 300 days. Alternatively, actual daily index value (dotted line) with LOWESS moving average regression (solid line) are both shown. The 14-day post index (orange) highlights breaks in trends (For interpretation of the references to color in this figure legend, the reader is referred to the web version of this article.).
Fig. 2
Fig. 2
Population-based seropositivity rates of Nucleocapsid (N) and Spike (S) protein IgG Assays. Seropositivity rates of IgG antibodies to Nucleocapsid (blue) and Spike (orange) proteins days following initial positive PCR test, found in the lower plot. Linear regression equation is displayed for both antibodies in the lower right corner, which starts at 21 days post positive PCR. 95% CI is represented by the shaded region above and below each linear line. The upper plot contains a frequency count of tests run (with kernel density plot) per day from index (For interpretation of the references to color in this figure legend, the reader is referred to the web version of this article.).
Fig. 3
Fig. 3
Comparison of antibody seropositivity over time by protein type and assay platform. Seropositivity rates of IgG antibodies to Spike (A and B) and Nucleocapsid (C and D) proteins by two separate assay platforms each over days post first positive PCR result for COVID-19. Data is smoothed using LOWESS and fitted with 95% confidence intervals for variance in sample sizes. Comparison between assay platform within protein types show similarities for Spike, but different trends for Nucleocapsid.
Fig. 4
Fig. 4
Population Nucleocapsid and Spike IgG seropositivity by Demographics. Nucleocapsid and spike IgG seropositivity rates after first positive PCR test for SARS-CoV-2 using LOWESS moving average for curve smoothing. (A) Rates by gender shown with S IgG following the same trend for males (blue) and females (green), (B) Rates by age, classified as <65 (black) or ≥65 years old (gold) (For interpretation of the references to color in this figure legend, the reader is referred to the web version of this article.).

References

    1. Hodgson S.H., Mansatta K., Mallett G., Harris V., Emary K.R.W., Pollard A.J. What defines an efficacious COVID-19 vaccine? A review of the challenges assessing the clinical efficacy of vaccines against SARS-CoV-2. Lancet Infect Dis. 2020;21(2):E26–E35. - PMC - PubMed
    1. Labcorp. LabCorp-COVID-19-antibody-tests-available-nationwide-no-upfront-out-of-pocket-costs [Internet]. 2020. Available from: https://www.labcorp.com/coronavirus-disease-covid-19/news/LabCorp-COVID-...
    1. Adams E., Ainsworth M., Anand R., Andersson R., Auckland K., Baillie J.K. Evaluation of antibody testing for SARS-CoV-2 using ELISA and lateral flow immunoassays. medRxiv. 2020
    1. Jiang S., Hillyer C., Du L. Neutralizing antibodies against SARS-CoV-2 and other human coronaviruses. Trends Immunol. 2020;41:355–359. - PMC - PubMed
    1. Fehr A.R., Perlman S. Coronaviruses. Vol. 1282. Methods in Molecular Biology; 2015. Coronaviruses: an overview of their replication and pathogenesis; pp. 1–23. - PMC - PubMed